Figure 6. SAS decreases IL-1β-induced mRNA expression of IL-6 in ARPE-19 and HRPE cells. A: ARPE-19 cells were starved in serum-free medium overnight and then incubated for 1 h with 0.5, 1, 2.5, or 5 µg/ml of SAS
before the addition of 10 ng/ml of IL-1β. After 12 h of culture, total RNA was extracted from the ARPE-19 cells, and semiquantitative
RT–PCR was performed to evaluate IL-6 and GAPDH mRNA levels. PCR products on agarose gel are shown. The data represent one
of three experiment performed. B: HRPE cells were starved in serum-free medium overnight and then incubated for 1 h with 0.5, 1, or 2.5 µg/ml of SAS before
the addition of 10 ng/ml of IL-1β. After 24 h of culture, cells were processed for RNA purification and analyzed using RT–PCR.
IL-6 mRNA expression levels were measured using GAPDH as an internal control. The results show the average fold change differences
compared to untreated control groups. # p<0.05 increase versus control group, * p<0.01 decrease versus IL-1β group. Results
shown are mean ± SEM of 3 independent experiments.
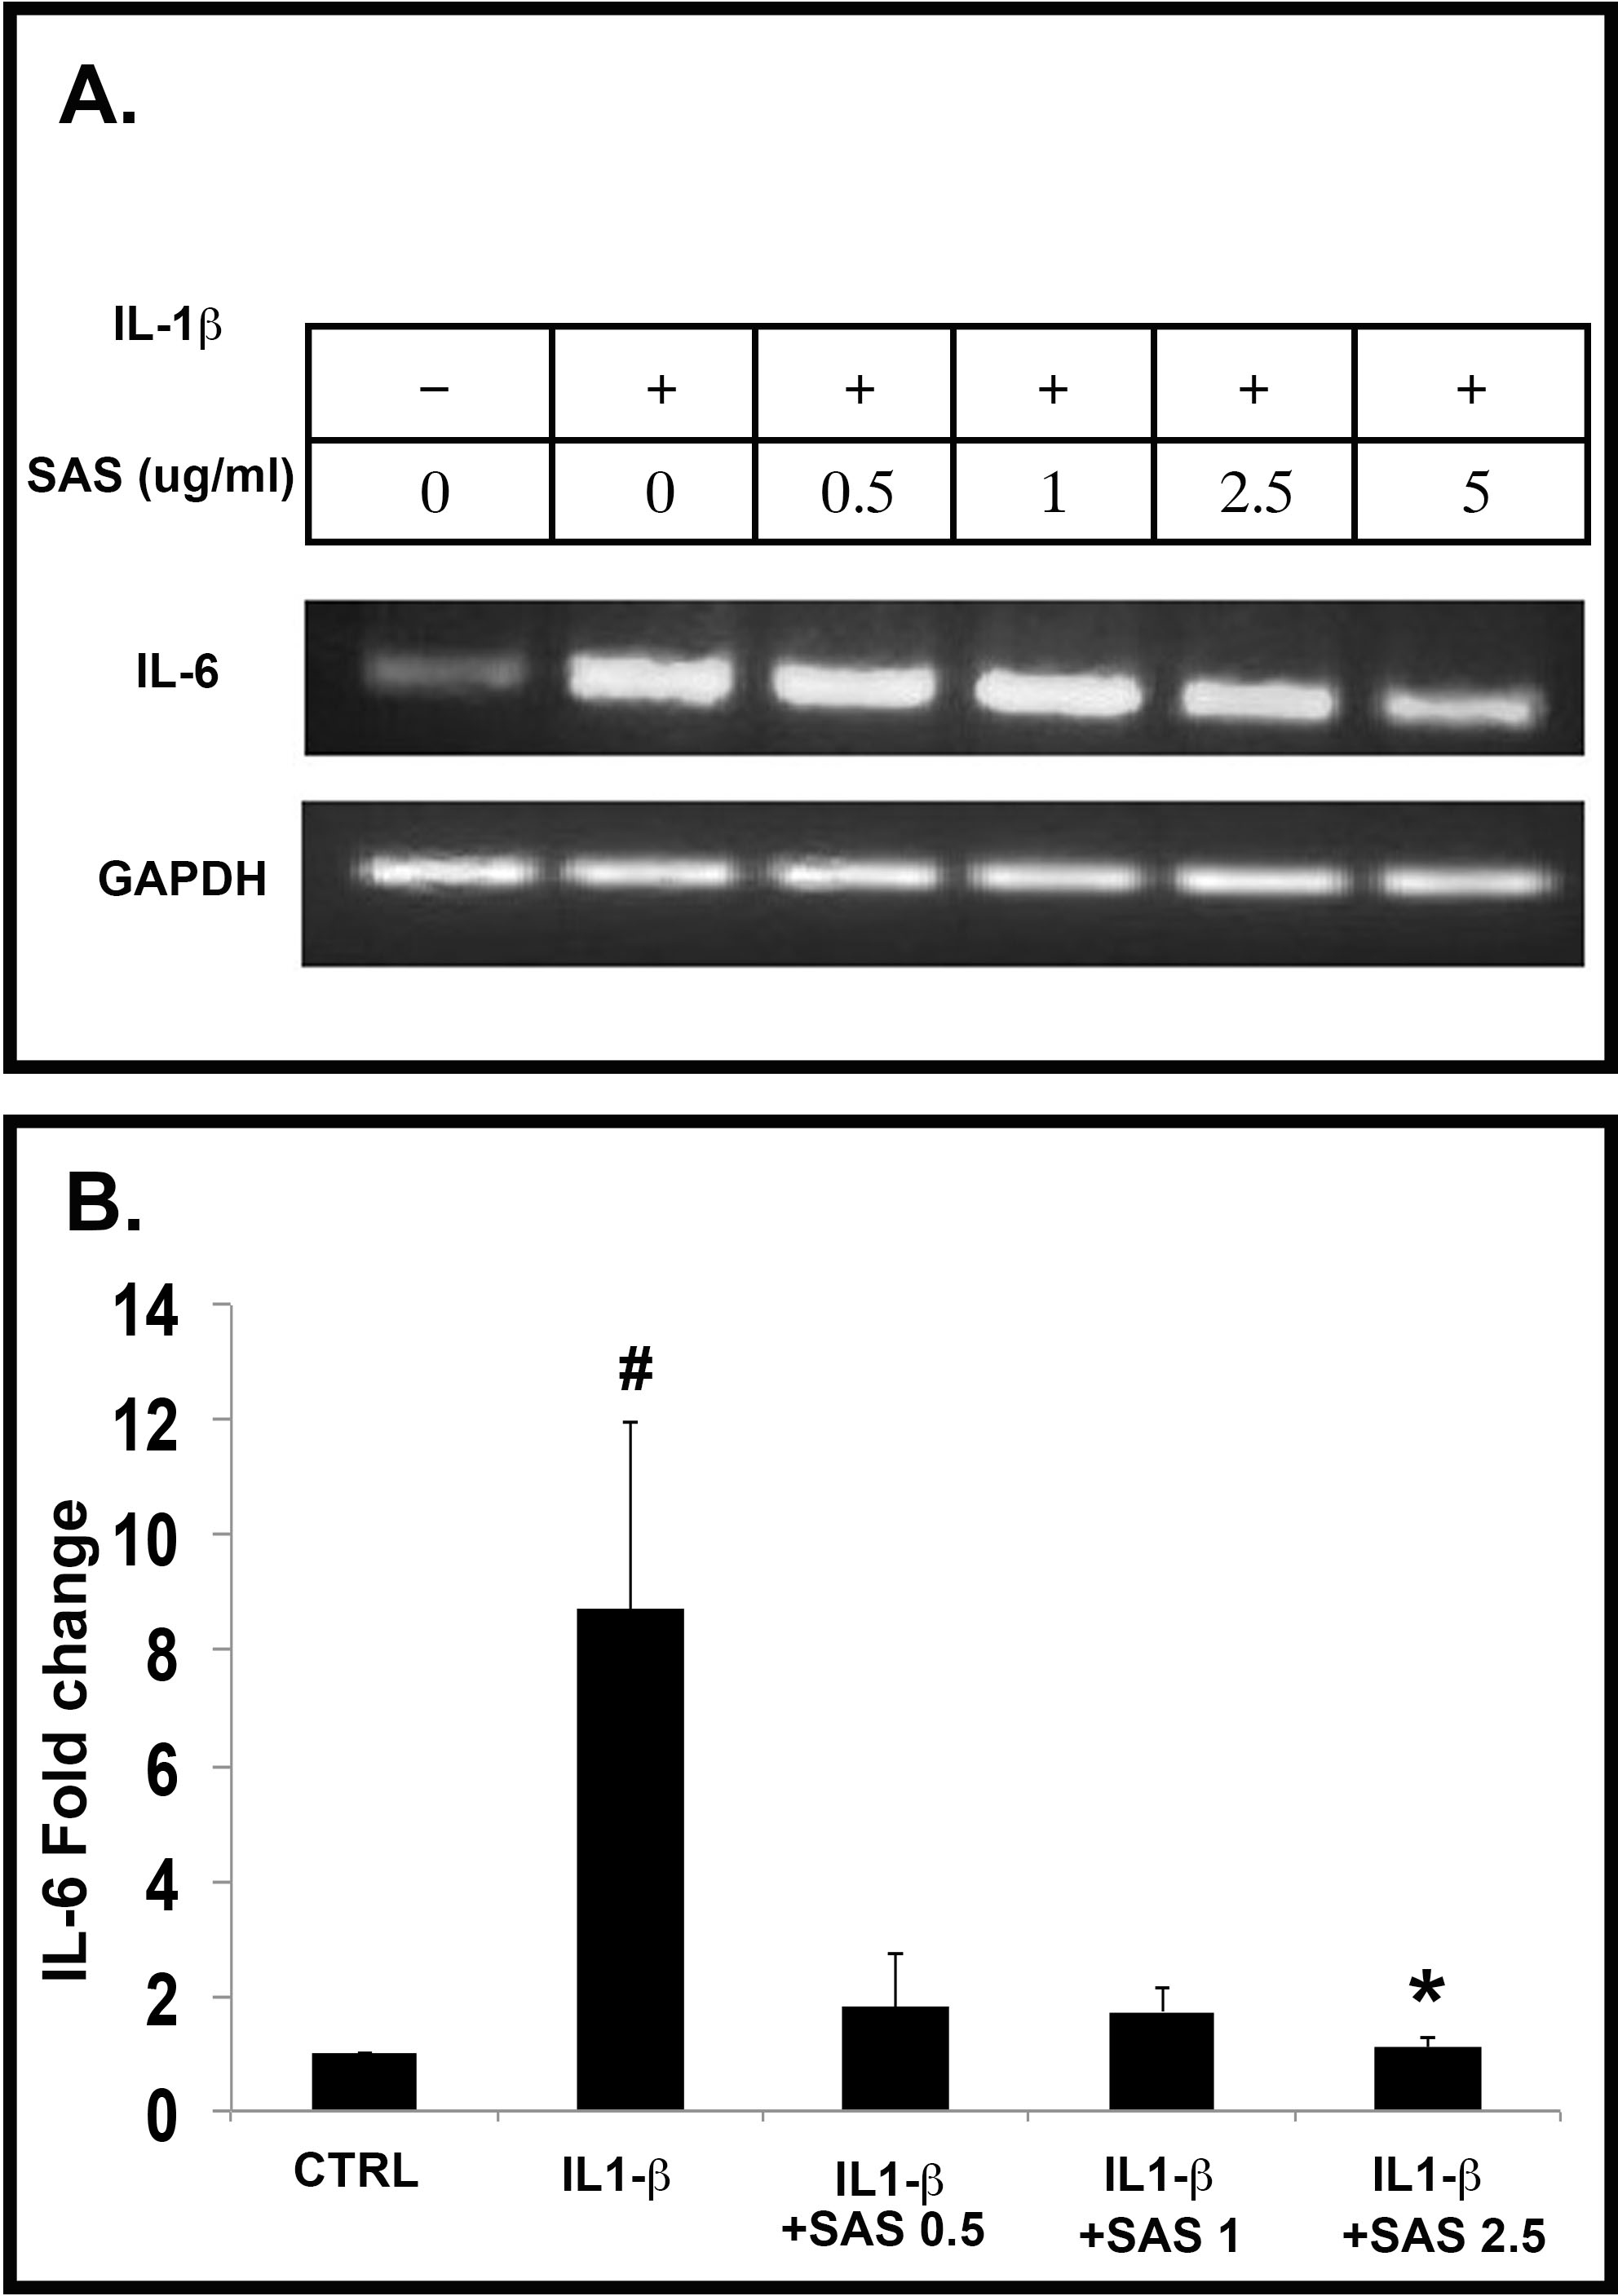
 Figure 6 of
Dardik, Mol Vis 2016; 22:548-562.
Figure 6 of
Dardik, Mol Vis 2016; 22:548-562.