Figure 5. Acquisition of RGC phenotypes with Atoh7 overexpression. A: Quantitative real-time PCR analysis showed Atoh7 gene expression is demonstrably upregulated with transfection of the Atoh7 vector (*** p<0.005). Transcript levels were normalized
to ACTB levels. The graph shows the mean ± standard deviation (SD; n = 3). B: Quantitative real-time PCR analysis confirmed Atoh7 overexpression activated RGC-related genes Brn3b and iSlet1 (* p<0.05). Transcript levels were normalized to ACTB levels. The graph shows the mean ± standard deviation (SD; n = 3).
C: Phase contrast images of transfected cell displaying RGC-like neuron morphology. Scale bar = 50 μm. D–F: Confocal immunofluorescent images of RGC-like cells, stained positive for Brn3b, Tuj, iSlet1, calretinin, and synaptophysin.
Scale bars = 50 μm. G: Ca2+ image of RGC-like cells loaded with Fluo-3 AM showed the Ca2+ influx was reduced by EGTA and stimulated with high-potassium Tyrode’s solution. Left panel: a confocal image of the representative
cell loaded with Fluo-3 AM Middle panel: after the application of EGTA Tyrode’s solution, Ca2+ concentration was reduced with diminished fluorescence intensity, captured at 25 s. Right panel: after the application of
high-potassium Tyrode’s solution, Ca2+ influx was stimulated with increased fluorescence intensity, captured at 35 s. Scale bars = 50 μm. H: Fluorescence-activated cell sorting (FACS) analysis showed approximately 23% of derived retinal neural cells were positive
for Brn3b.
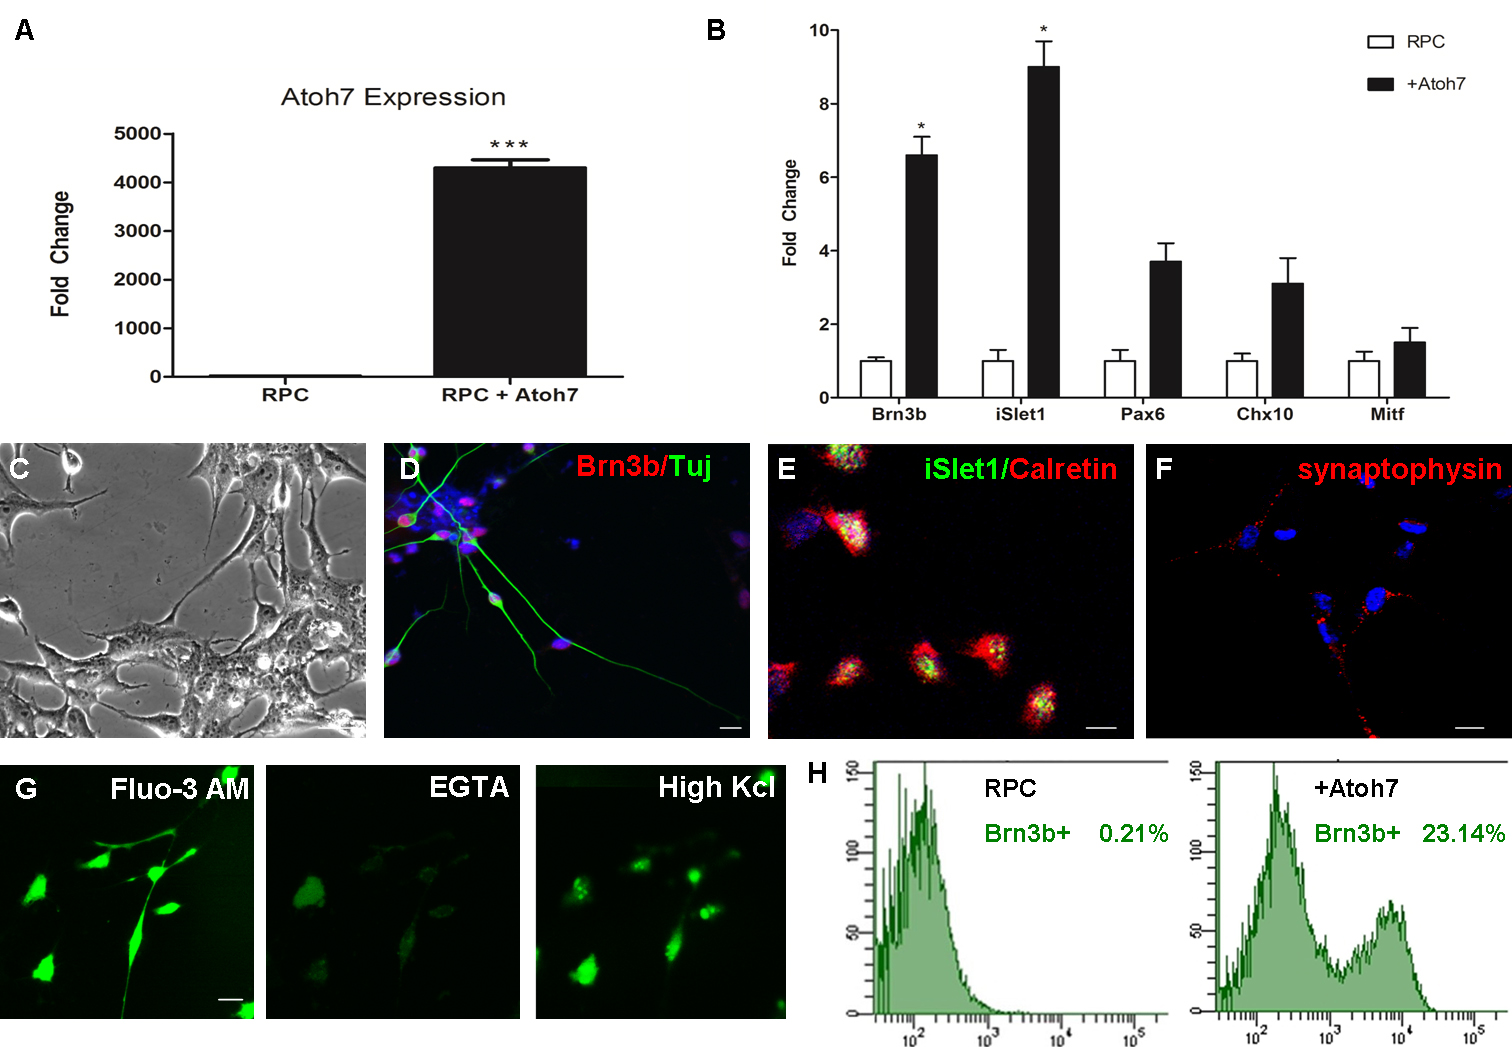
 Figure 5 of
Deng, Mol Vis 2016; 22:536-547.
Figure 5 of
Deng, Mol Vis 2016; 22:536-547.