Figure 3. Directed derivation of RPCs with the addition of DKK1, Noggin, and Lefty A. A–B: Phase contrast images of representative Tenon’s-derived induced pluripotent stem cell (TiPSC)-derived neuroepithelial colonies
(A, displaying tightly packed colony morphology) and randomly differentiated colonies (B, displaying flat non-neural morphology) after 10 days of culture on Matrigel. Scale bar = 100 μm. C–F: Confocal images of neuroepithelial colonies stained with early eye field markers Pax6, Chx10, Rx, Otx2, and ZO1. Scale bars
= 100 μm. G: Quantitative real-time PCR analysis showed Pax6 and Lhx2 were further upregulated in both groups after attachment for another 10 days, whereas eye field-specific regional genes Rax, Chx10, Six3, and Six6 are upregulated substantially in the DNL group when compared with the control group (* p<0.05); correspondingly, HOXB4 (the hindbrain and spinal cord) and AFP (an endoderm marker) are largely suppressed in the DNL group (* p<0.05, ** p<0.01). + = the DNL group, - = the control group.
Transcript levels were normalized to ACTB levels. The graph above shows the mean ± standard deviation (SD; n = 3).
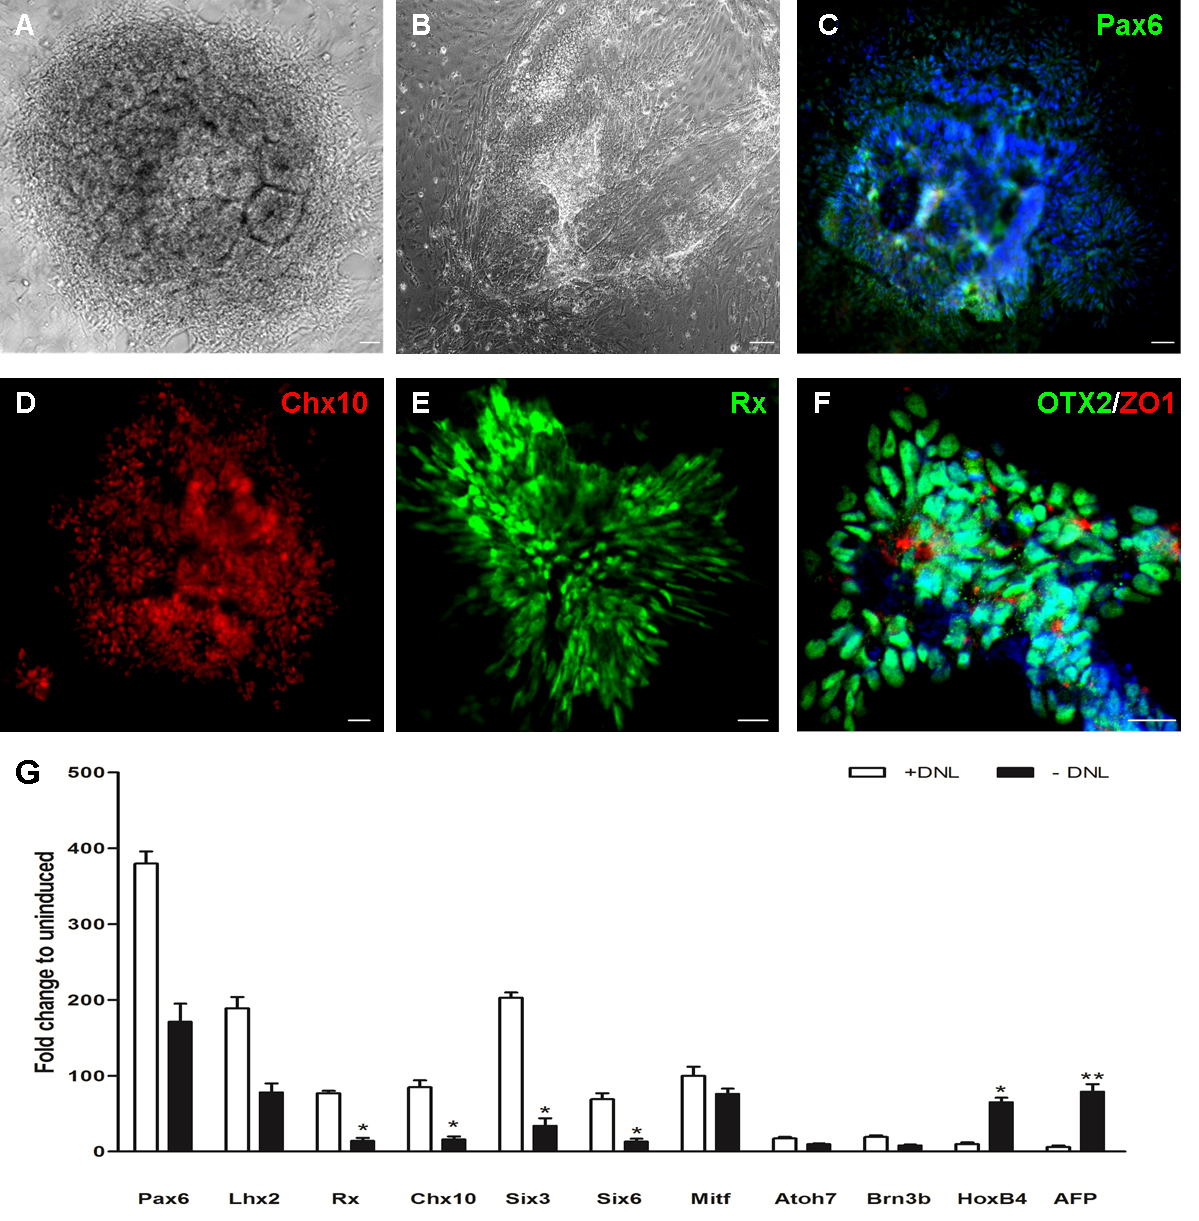
 Figure 3 of
Deng, Mol Vis 2016; 22:536-547.
Figure 3 of
Deng, Mol Vis 2016; 22:536-547.