Figure 2. Primitive neuroectodermal specification of human TiPSCs through EB formation. A: Phase contrast images of an established Tenon’s-derived induced pluripotent stem cell (TiPSC) line at passage P 33, displaying
typical undifferentiated human embryonic stem cell (hESC)-like colony morphology. Scale bar = 100 μm. B–D: Confocal immunofluorescent images of undifferentiated TiPSC clones, stained positive for pluripotency associated markers
Oct-4, Nanog, and Sox2 but negative for panneural markers Pax6, Otx2, and Nestin. Nuclei were stained with 4’,6-diamidino-2-phenylindole
(DAPI). Scale bars = 50 μm. E: Quantitative real-time PCR analysis confirmed pluripotent genes Oct3/4 and Nanog markedly decreased after 6 days of suspension culture (* p<0.05), concurrent with the equivalent upregulation of early neuroectodermal-associated
genes Pax6 and Lhx2 in two groups (** p<0.01). Transcript levels were normalized to ACTB levels. The graph shows the mean ± standard deviation
(SD; n = 3). F–H: Confocal immunofluorescent images of embryonic bodies (EBs) stained with early neuroectodermal markers Sox2, Pax6, Otx2,
and Nestin. Scale bars = 50 μm.
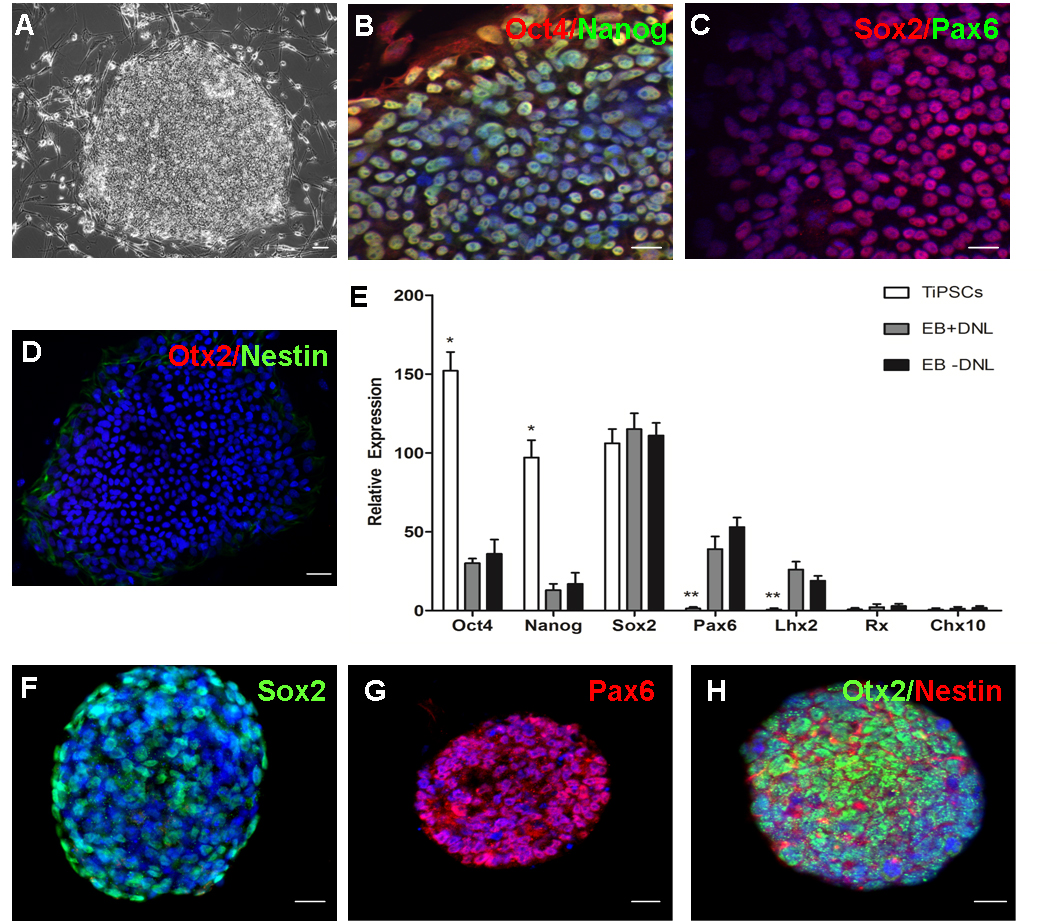
 Figure 2 of
Deng, Mol Vis 2016; 22:536-547.
Figure 2 of
Deng, Mol Vis 2016; 22:536-547.