Figure 9. Averaged collagen anisotropy and density maps. Contour maps of fibrillar collagen (A, B) anisotropy and (C, D) density in the carrier and affected ADAMTS10 mutant posterior canine scleras, expressed as group averages. A marked reduction in collagen density in the affected group
is again visible. Broken line: border of the mid-posterior (MPS) and peripapillary (PPS) scleral regions. Data sampling interval: 0.4 mm.
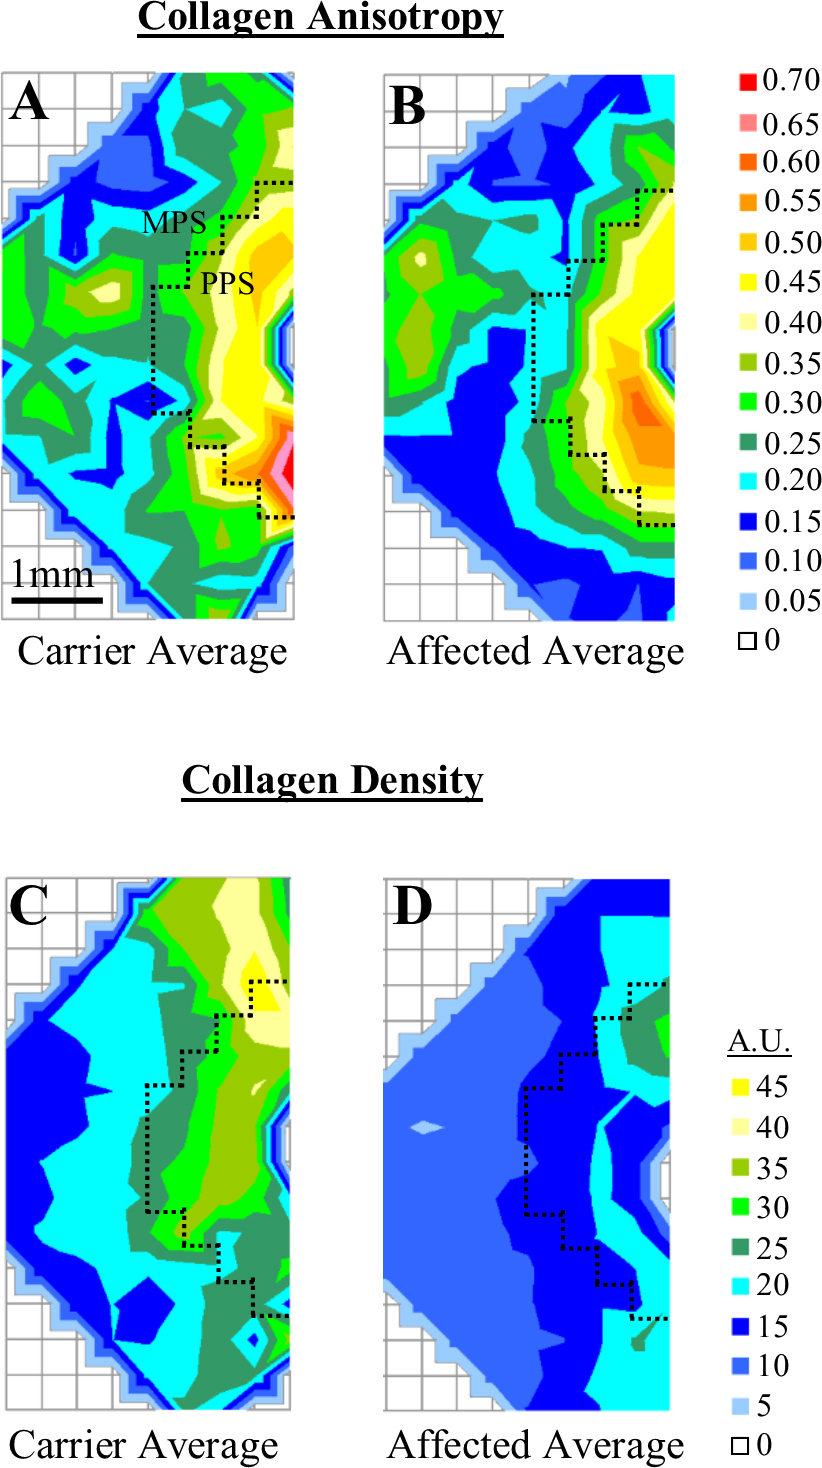
 Figure 9 of
Boote, Mol Vis 2016; 22:503-517.
Figure 9 of
Boote, Mol Vis 2016; 22:503-517.