Figure 8. Collagen density maps. Contour maps of relative fibrillar collagen density across the (A–C) carrier and (D–F) affected ADAMTS10 mutant posterior canine scleras. Broken line: border of the mid-posterior (MPS) and peripapillary (PPS) scleral regions. Collagen density is visibly reduced in all areas
of the affected specimens as compared to carrier controls. Data sampling interval: 0.4 mm.
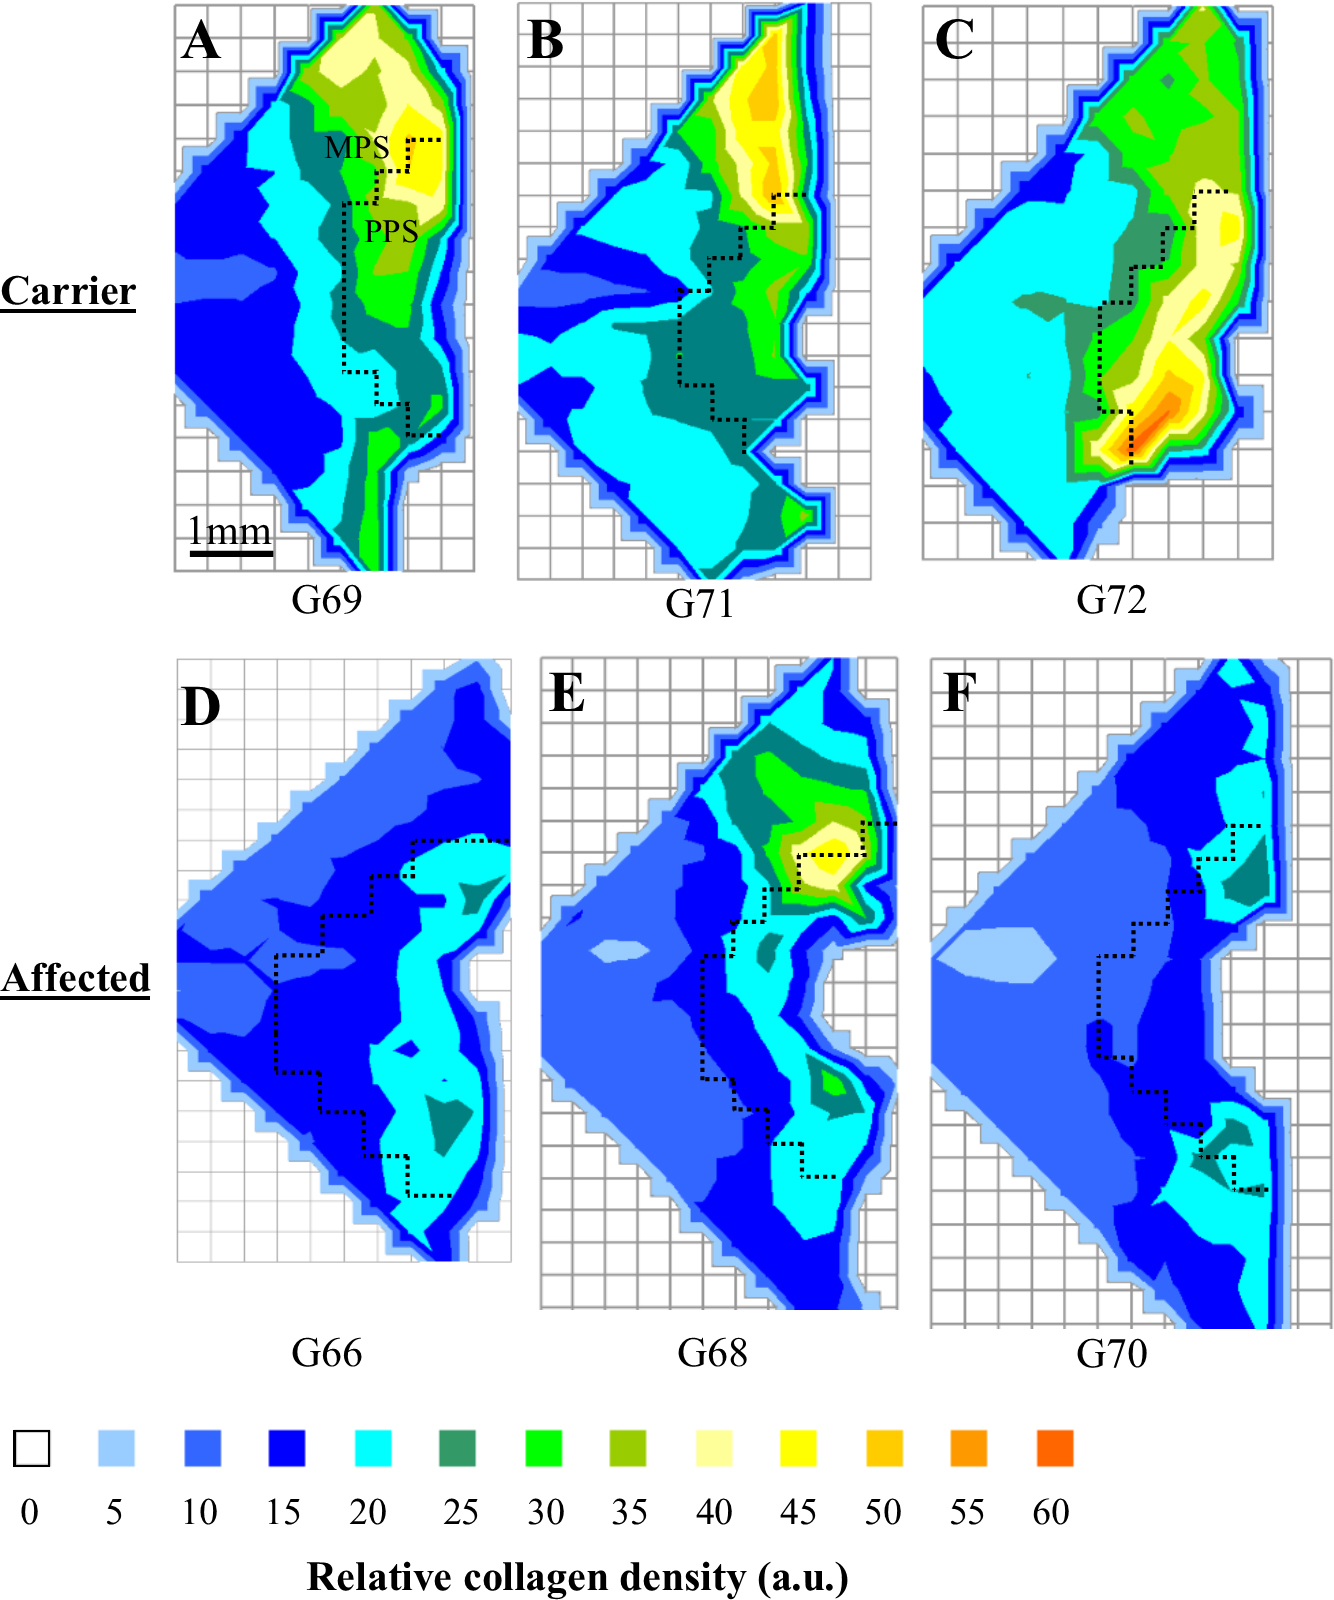
 Figure 8 of
Boote, Mol Vis 2016; 22:503-517.
Figure 8 of
Boote, Mol Vis 2016; 22:503-517.