Figure 2. WAXS analysis. A: Example wide-angle X-ray scattering (WAXS) pattern from the posterior canine sclera. The spread of intensity as a function
of angle ϕ around the collagen intermolecular X-ray scatter peak (arrow) may be analyzed to yield the fibril orientation distribution
function. B: Power-law background function (broken line) fitted to a radial profile (solid line) through the pattern shown in A. A unique background function was independently fitted along 256 equally spaced radial directions for each WAXS pattern.
Subtraction of these functions enabled the collagen signal (shaded region) to be extracted in two dimensions. Arrow: Collagen peak. C: Angular X-ray scatter intensity profile extracted from the pattern shown in A. The distribution has two components: scatter arising from isotropic collagen, Ii, and scatter arising from preferentially aligned collagen, Ia. D: Collagen orientation distribution plot. The aligned collagen scatter is displayed in polar coordinates, where the length
of a vector, r, is proportional to the relative number of collagen fibrils preferentially aligned at angle ϕ.
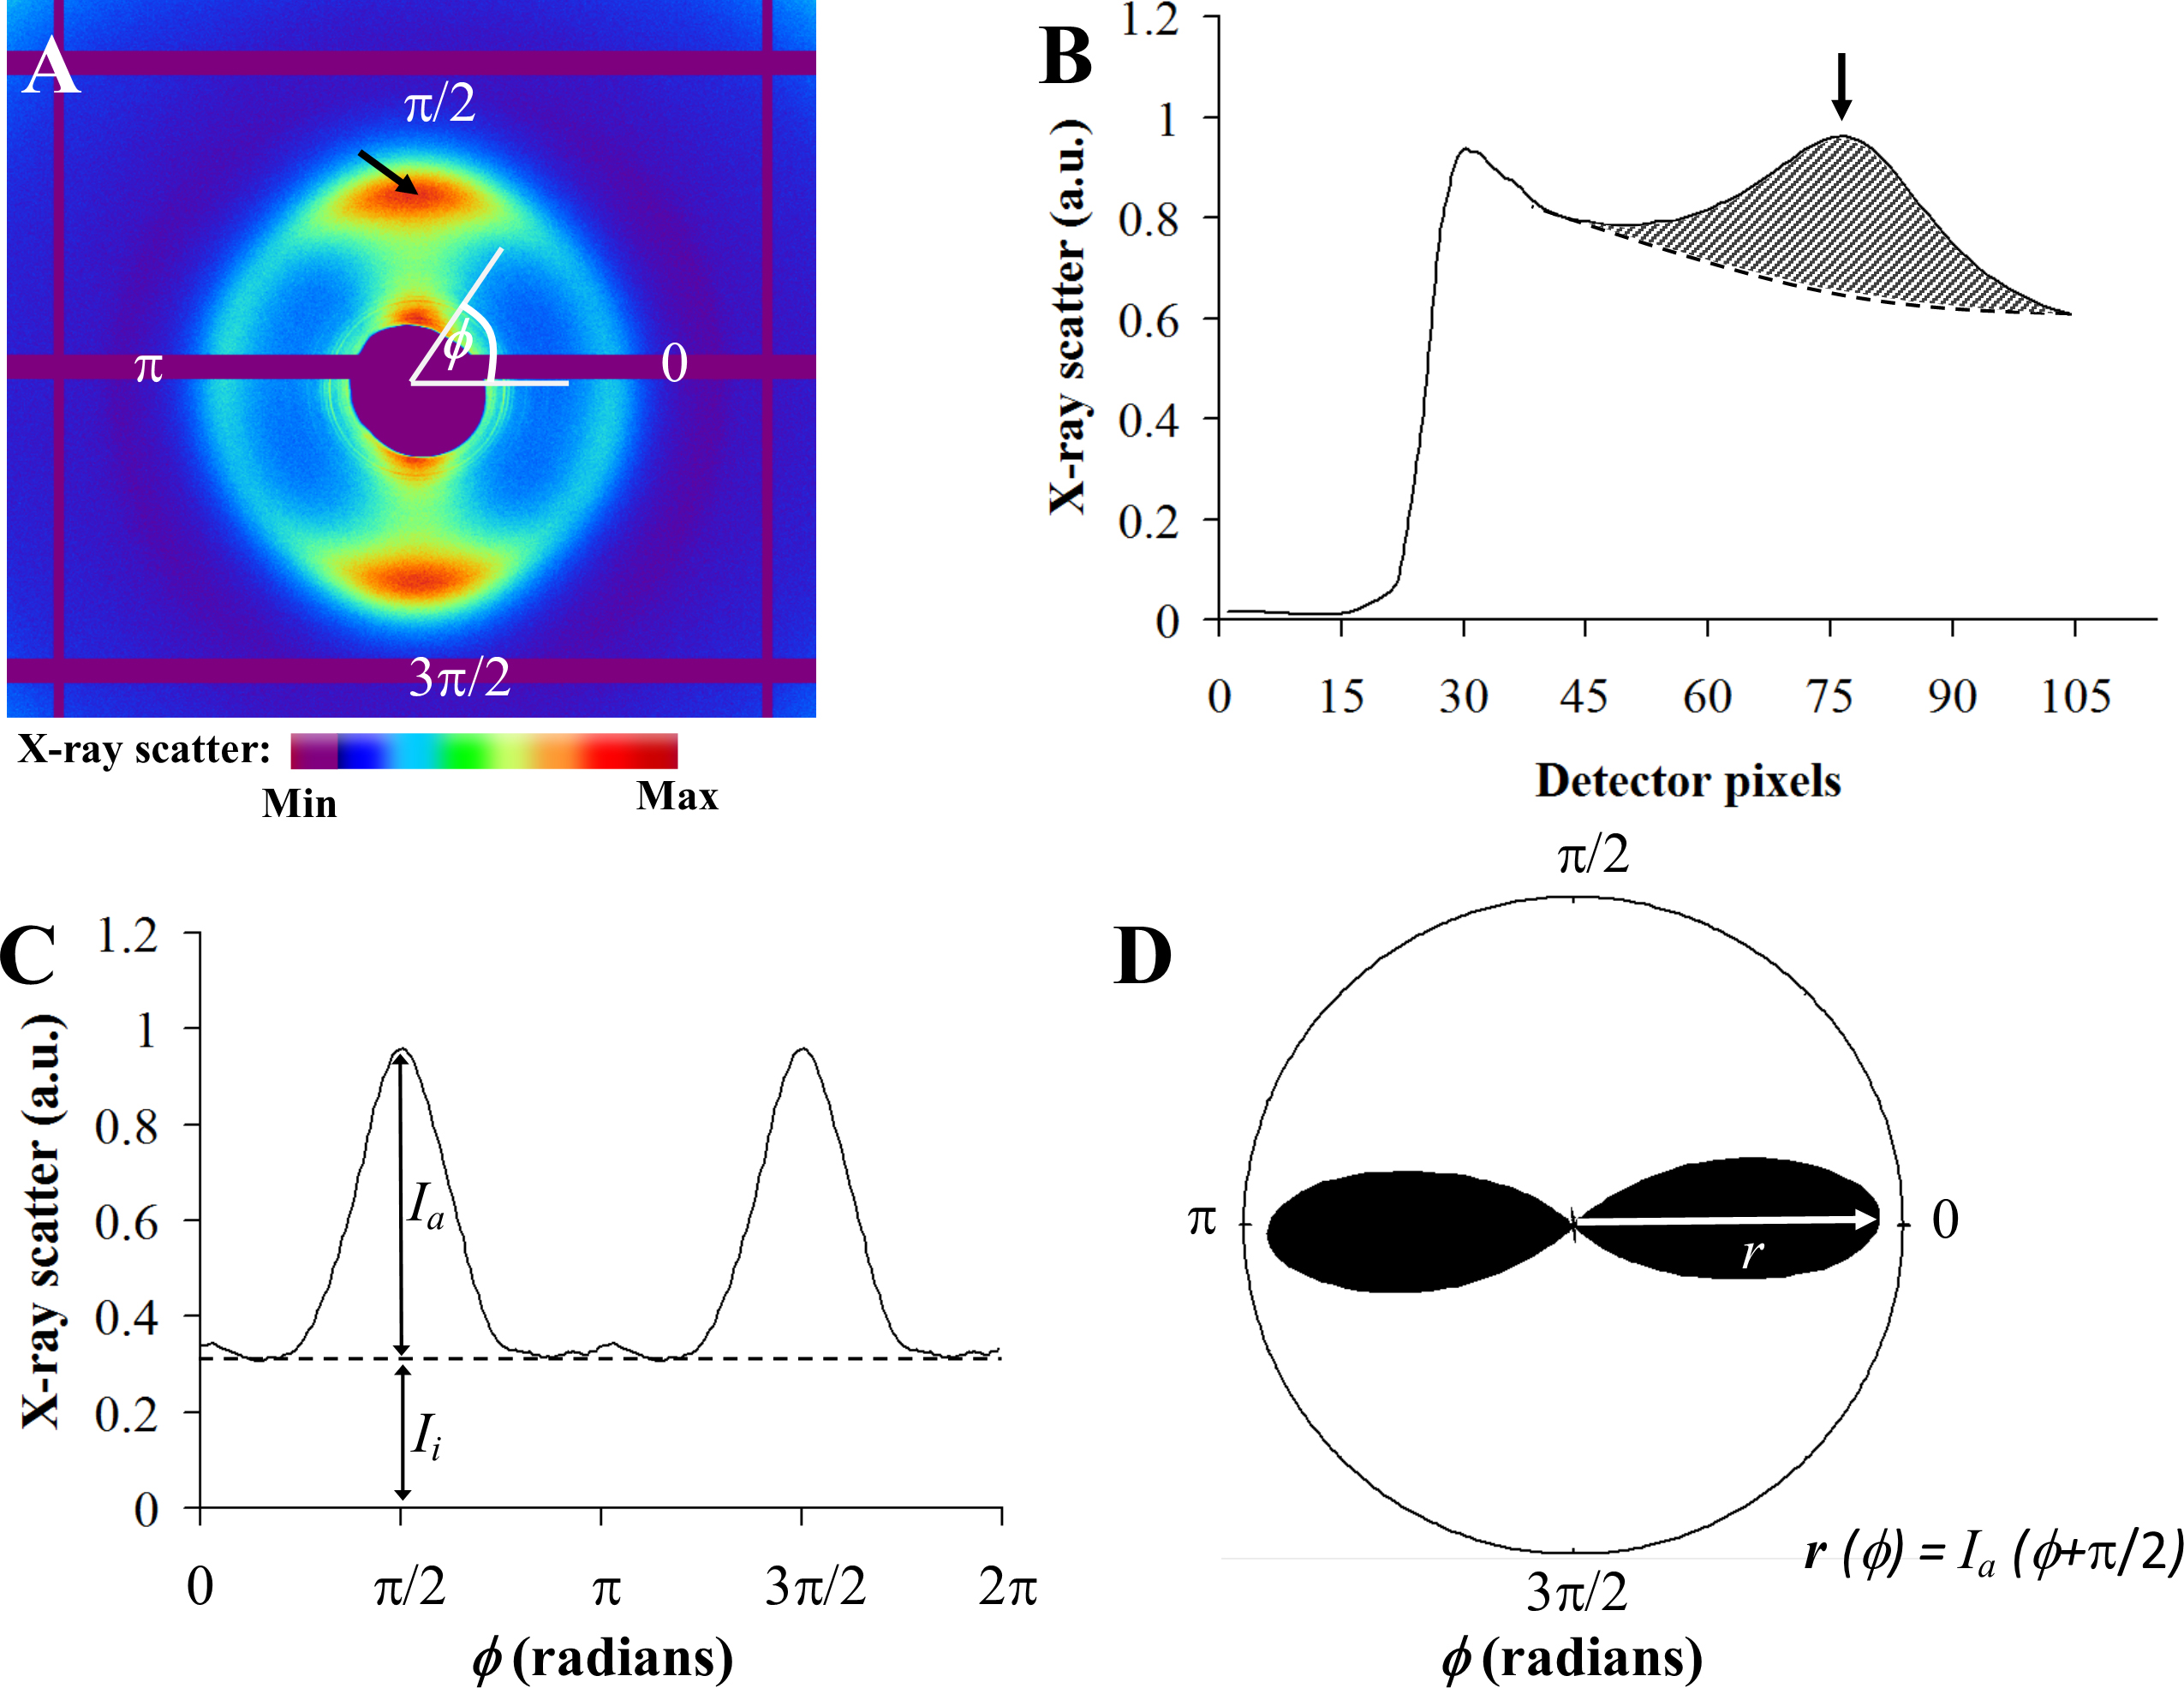
 Figure 2 of
Boote, Mol Vis 2016; 22:503-517.
Figure 2 of
Boote, Mol Vis 2016; 22:503-517.