Figure 6. Scatterplot of gene product cellular components generated from differentially expressed genes. Gene Ontology (GO) terms from
the differential gene expression lists were submitted to the REViGO web server. GO terms are represented by circles and are
plotted according to similarity to other GO terms, and size is proportional to frequency of the GO term. Circle color defines
the log10 p value (red is larger, blue is smaller). A: The retinal degenerate Royal College of Surgeons (RCSsham) versus wild-type Long Evans (LEsham) upregulated gene list produced five affected cellular components. B: Only one process was identified in the downregulated gene list. No significant cellular components were identified in either
of the Royal College of Surgeons rats with a subretinal injection of human forebrain derived neural progenitor cells (RCShNPCs) versus RCSsham gene lists. Significance was accepted at a Benjamini-Hochberg p value of less than 0.01.
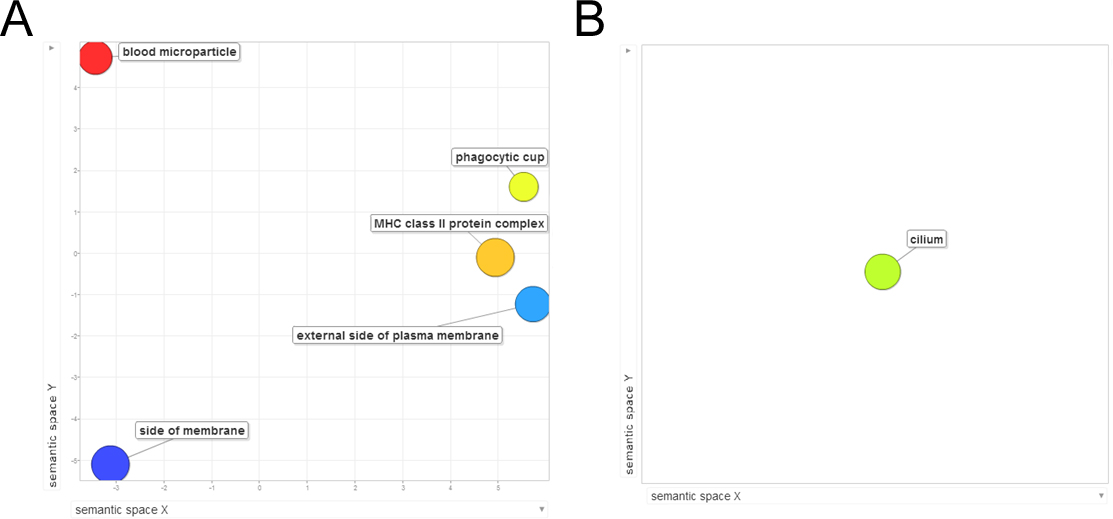
 Figure 6 of
Jones, Mol Vis 2016; 22:472-490.
Figure 6 of
Jones, Mol Vis 2016; 22:472-490.