Figure 2. Hierarchical cluster analysis displays gene expression changes in LEsham, RCSsham, and RCShNPCs rats. Gene expression profiles of wild-type Long Evans (LEsham, n = 2) rats were compared to retinal degenerate Royal College of Surgeons (RCSsham, n = 2) rats and RCS rats with a subretinal injection of human forebrain derived neural progenitor cells (RCShNPCs, n = 2).
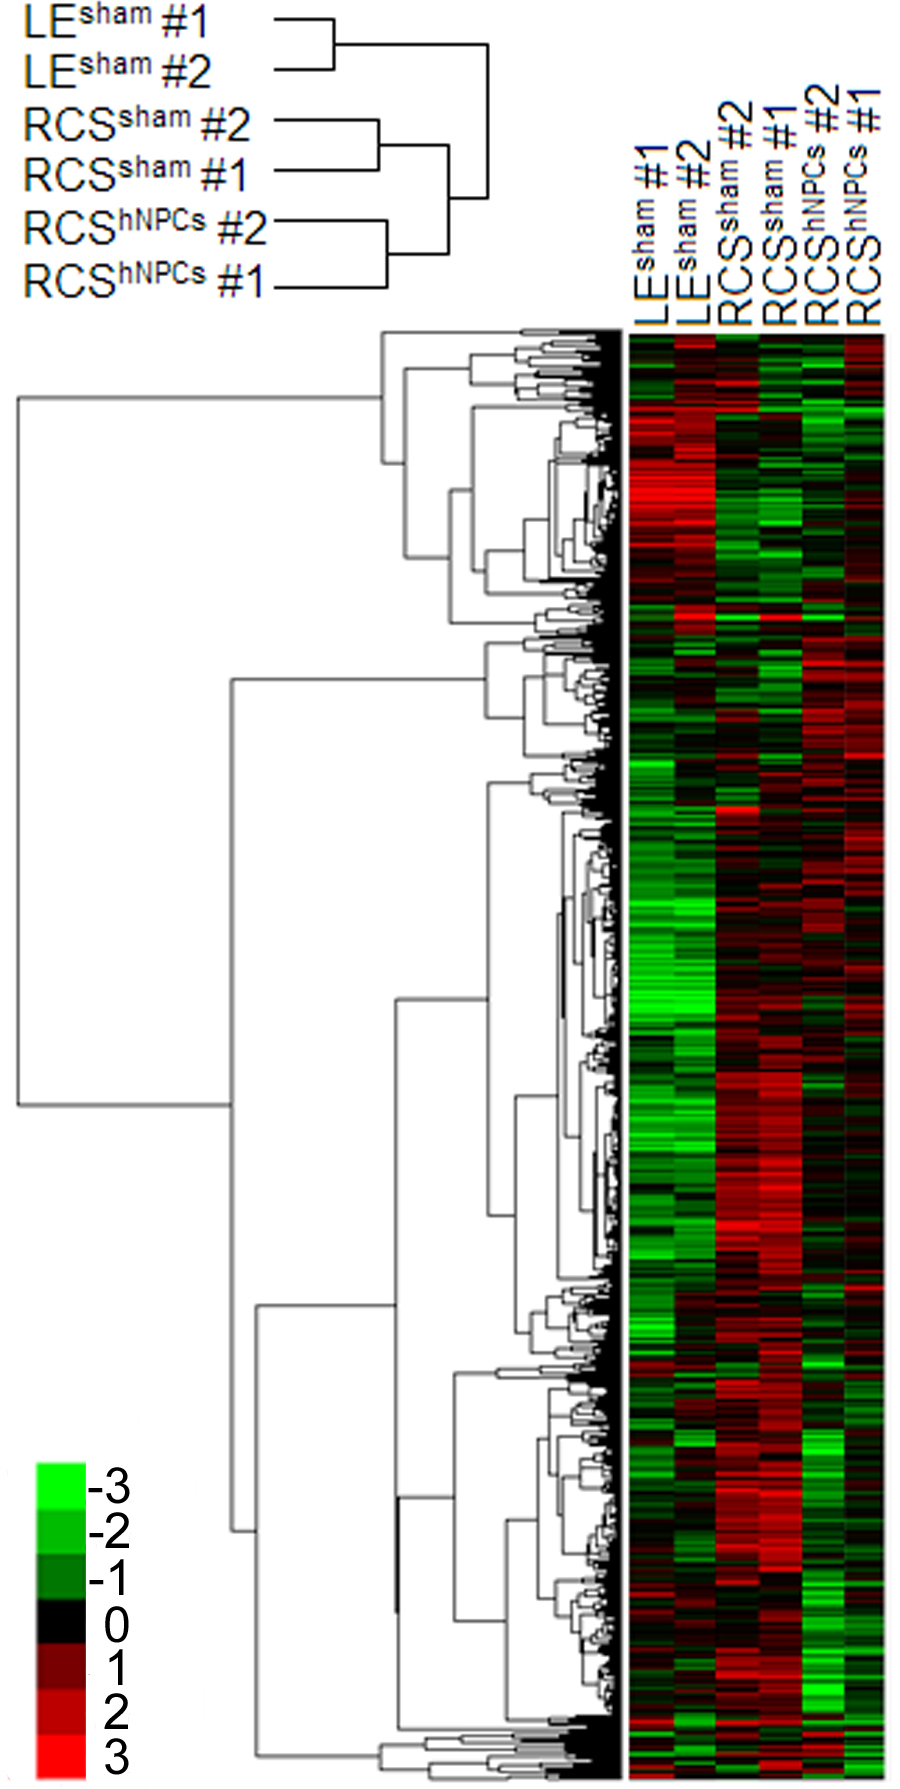
 Figure 2 of
Jones, Mol Vis 2016; 22:472-490.
Figure 2 of
Jones, Mol Vis 2016; 22:472-490.