Figure 5. Association of 381 variable positions on mtDNA with POAG in African-Americans. The number of individuals estimated to differ
from the rCRS reference sequence in the POAG case pool (n=1,217) was compared to the number of estimated variant individuals
in the control pool (n=782) for each variable position, the significance of the predicted difference was assessed using a
Chi-square test, and the negative log10 of the resulting p value is plotted. Variable positions annotated as having a disease association in MITOMAP or as “pathogenic”
or “likely pathogenic” by the NCBI variant viewer are indicated by markers with solid red fill. Selected markers are identified
by their coordinates on the rCRS reference sequence.
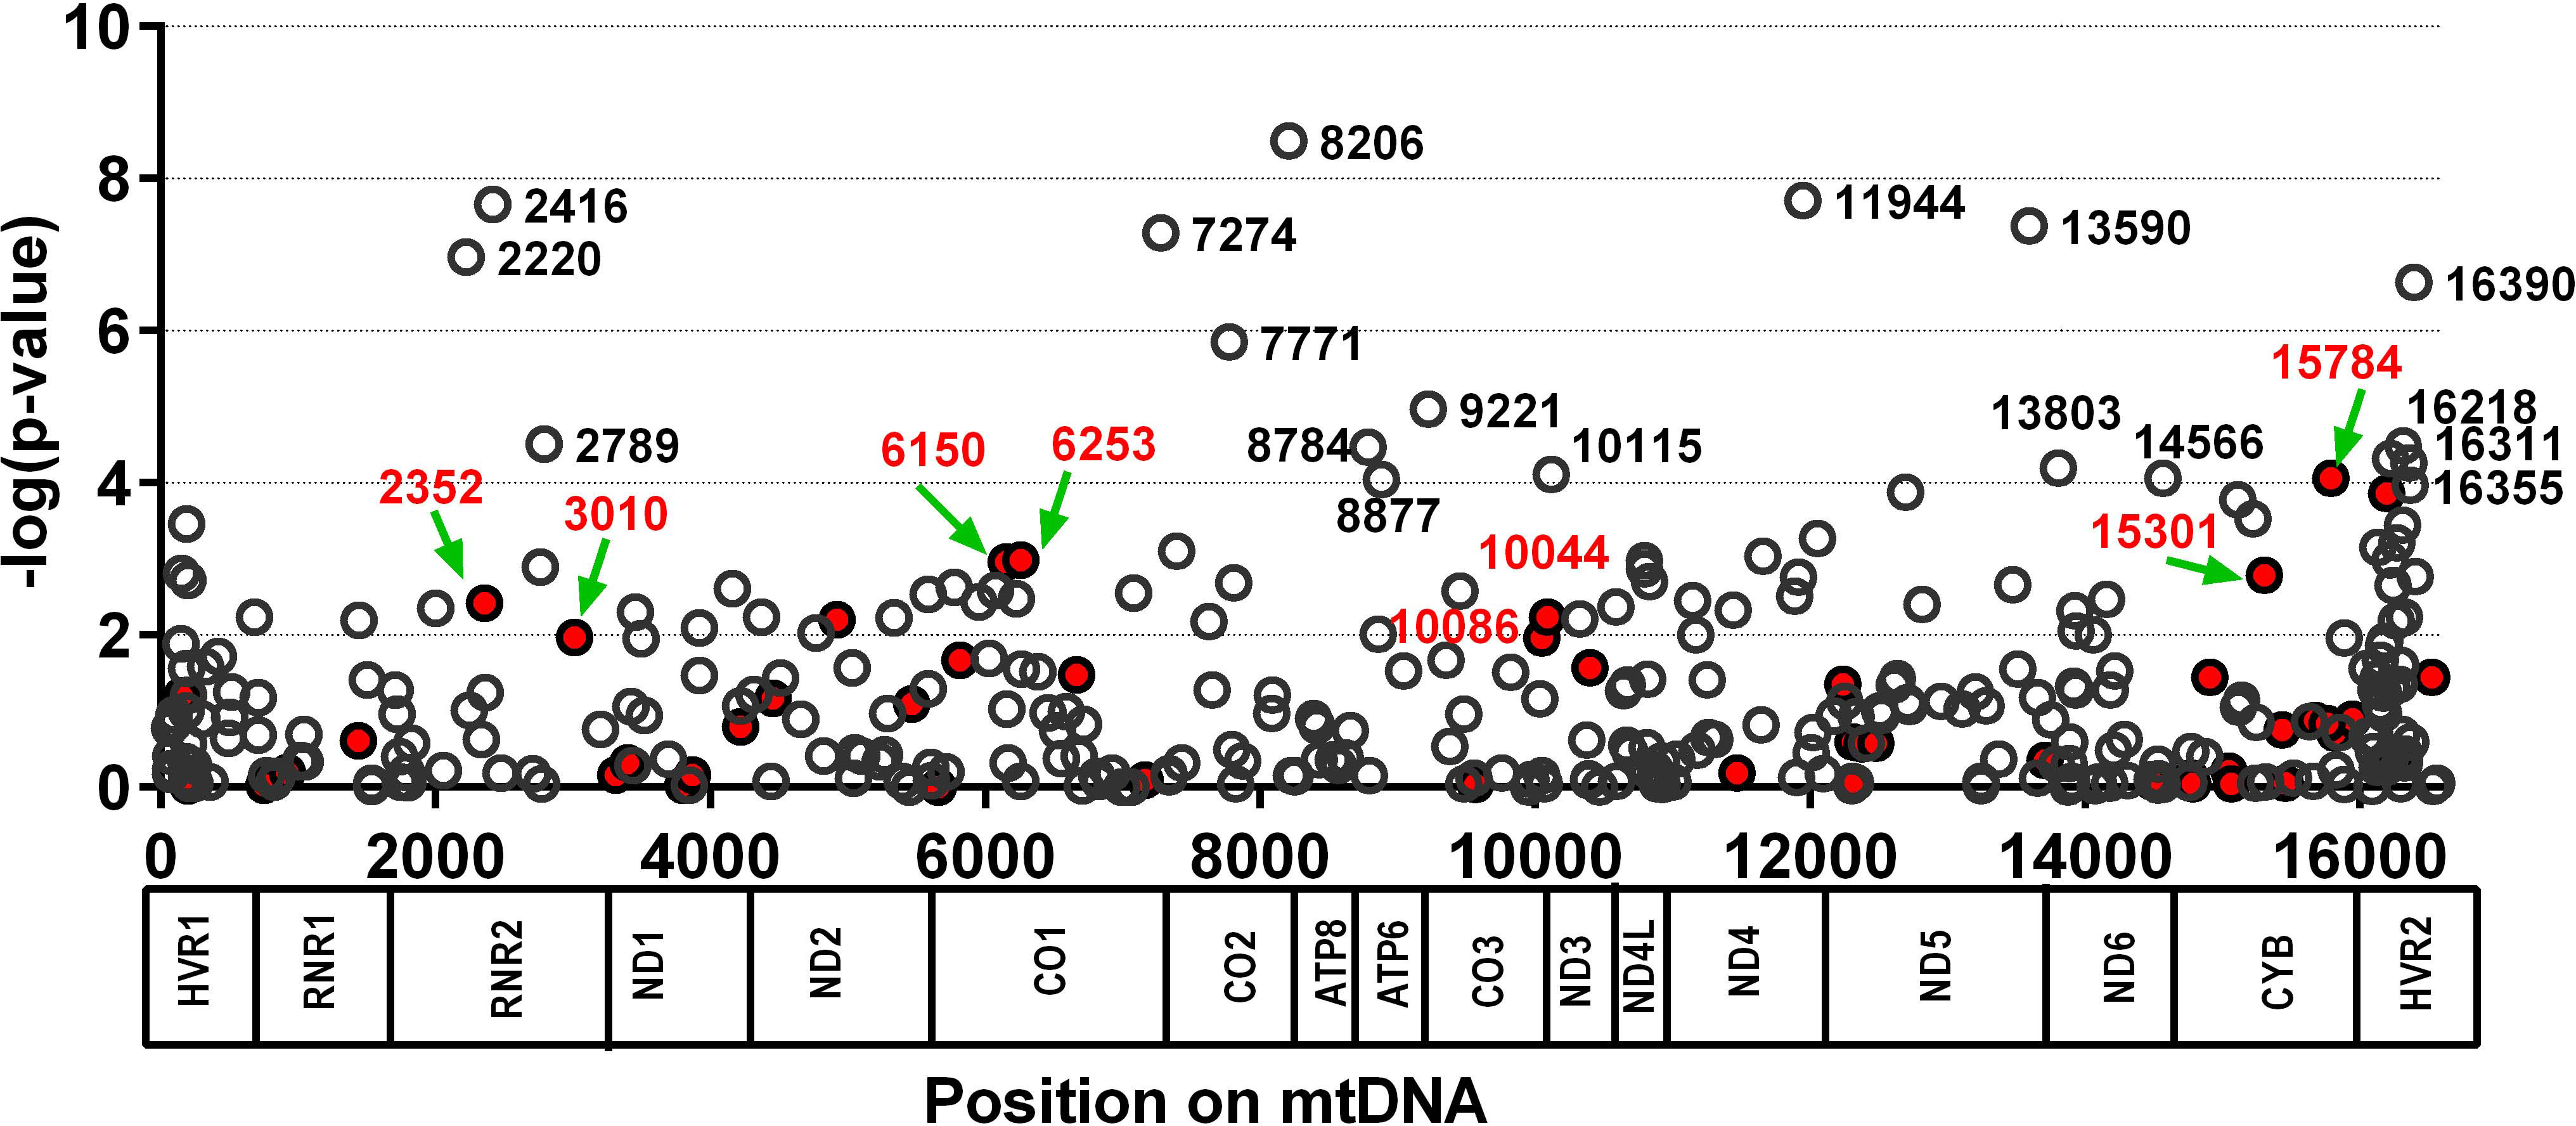
 Figure 5 of
Collins, Mol Vis 2016; 22:454-471.
Figure 5 of
Collins, Mol Vis 2016; 22:454-471.