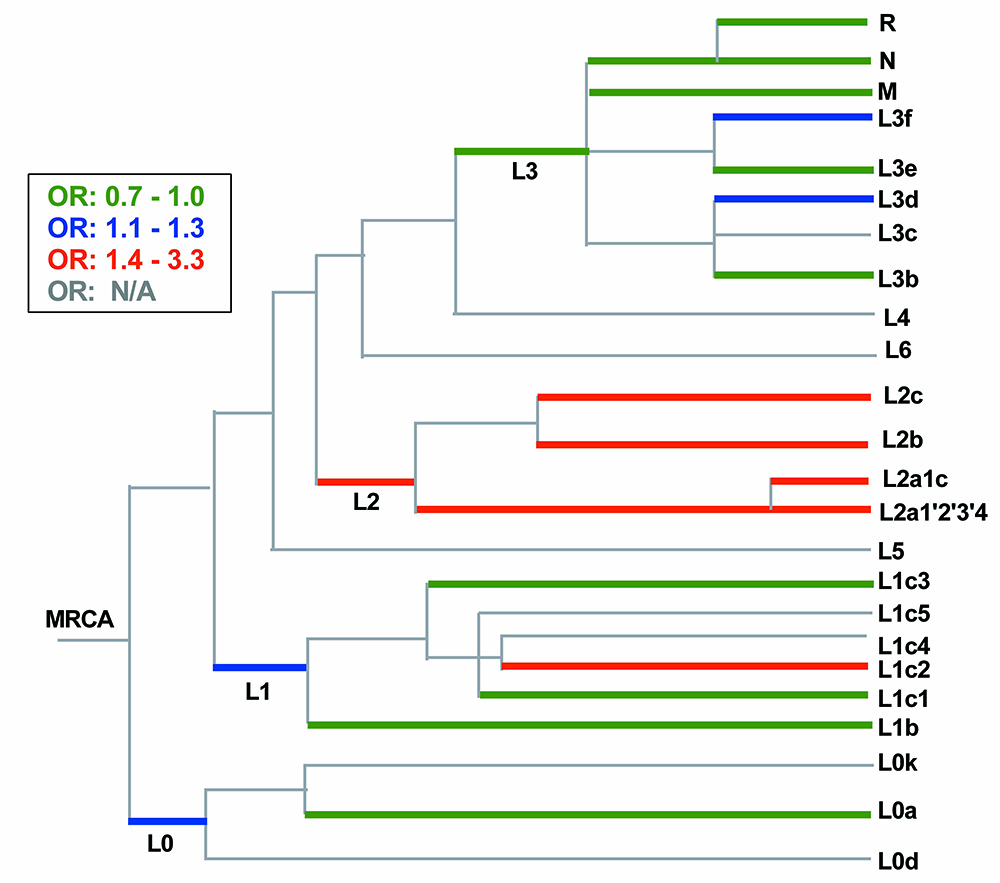
Figure 4. Pool-seq on POAG cases versus controls implicated the L1c2 and L2 branches of the mitochondrial phylogenetic tree. The relationships
among haplogroups detected in the POAAGG study population are represented in schematic form, with branch lengths representing
approximate divergence times from the most recent common ancestor (MRCA), with branching order adapted from Behar et al. and
Schlebush et al. [
9,
53] Colored shading indicates the degree of imbalance observed in the POAG versus case pools, expressed as odds ratios (OR)
from estimated population frequencies for one or more variants associated with that lineage. Mitochondrial ancestry implicated
in higher POAG risk (case: control OR >1.4) is indicated by red shading, moderate risk is indicated by blue, and mitochondrial
ancestry that may be protective is indicated by green. All depicted haplogroups are African with the exception of branches
R, M and N, which are ancestral to Asians and European populations. Haplogroup L1c2, is defined in part by the disease-associated
missense variants m.6150G>A and 6253T>C in
MT-CO1, with subgroups L1c2b1a'b also having the m.2220T>C variant in
MT-RNR2. The L2 lineages are associated with variant m.2416T>C in
MT-RNR2 and other variants. The m.3010G>A variant in
MT-RNR2, linked to linezolid sensitivity, has arisen on branch L2a1c, and a recent European haplogroup, H65a (not shown).
 Figure 4 of
Collins, Mol Vis 2016; 22:454-471.
Figure 4 of
Collins, Mol Vis 2016; 22:454-471.