Figure 2. Pool-seq identified hundreds of variable positions on mtDNA, mostly associated with one or more African haplogroups. The mean
variance frequency at each of the 16,549 positions on mtDNA is plotted as a percentage for all 43 pools, representing a total
of 1,999 individuals (A). Variant positions that are associated the most common African-American mitochondrial macro haplogroups are indicated with
colored markers. Uncolored circles represent variants associated with multiple haplogroups, or subgroups of the major groups
listed in the legend. Panel B compares individual Sanger sequencing results on 1,999 individuals for a 605 bp region within the MT-CO1 gene to Pool-seq results on the same group. The location and population frequencies from Sanger sequencing (red solid diamonds)
are plotted with those inferred by Pool-seq (gray open circles), and numeric labels indicate the position on the mtDNA reference
sequence. “FP” denotes two of the positions, 6420 and 6442, that were categorized as noisy and excluded from analysis as false
positives.
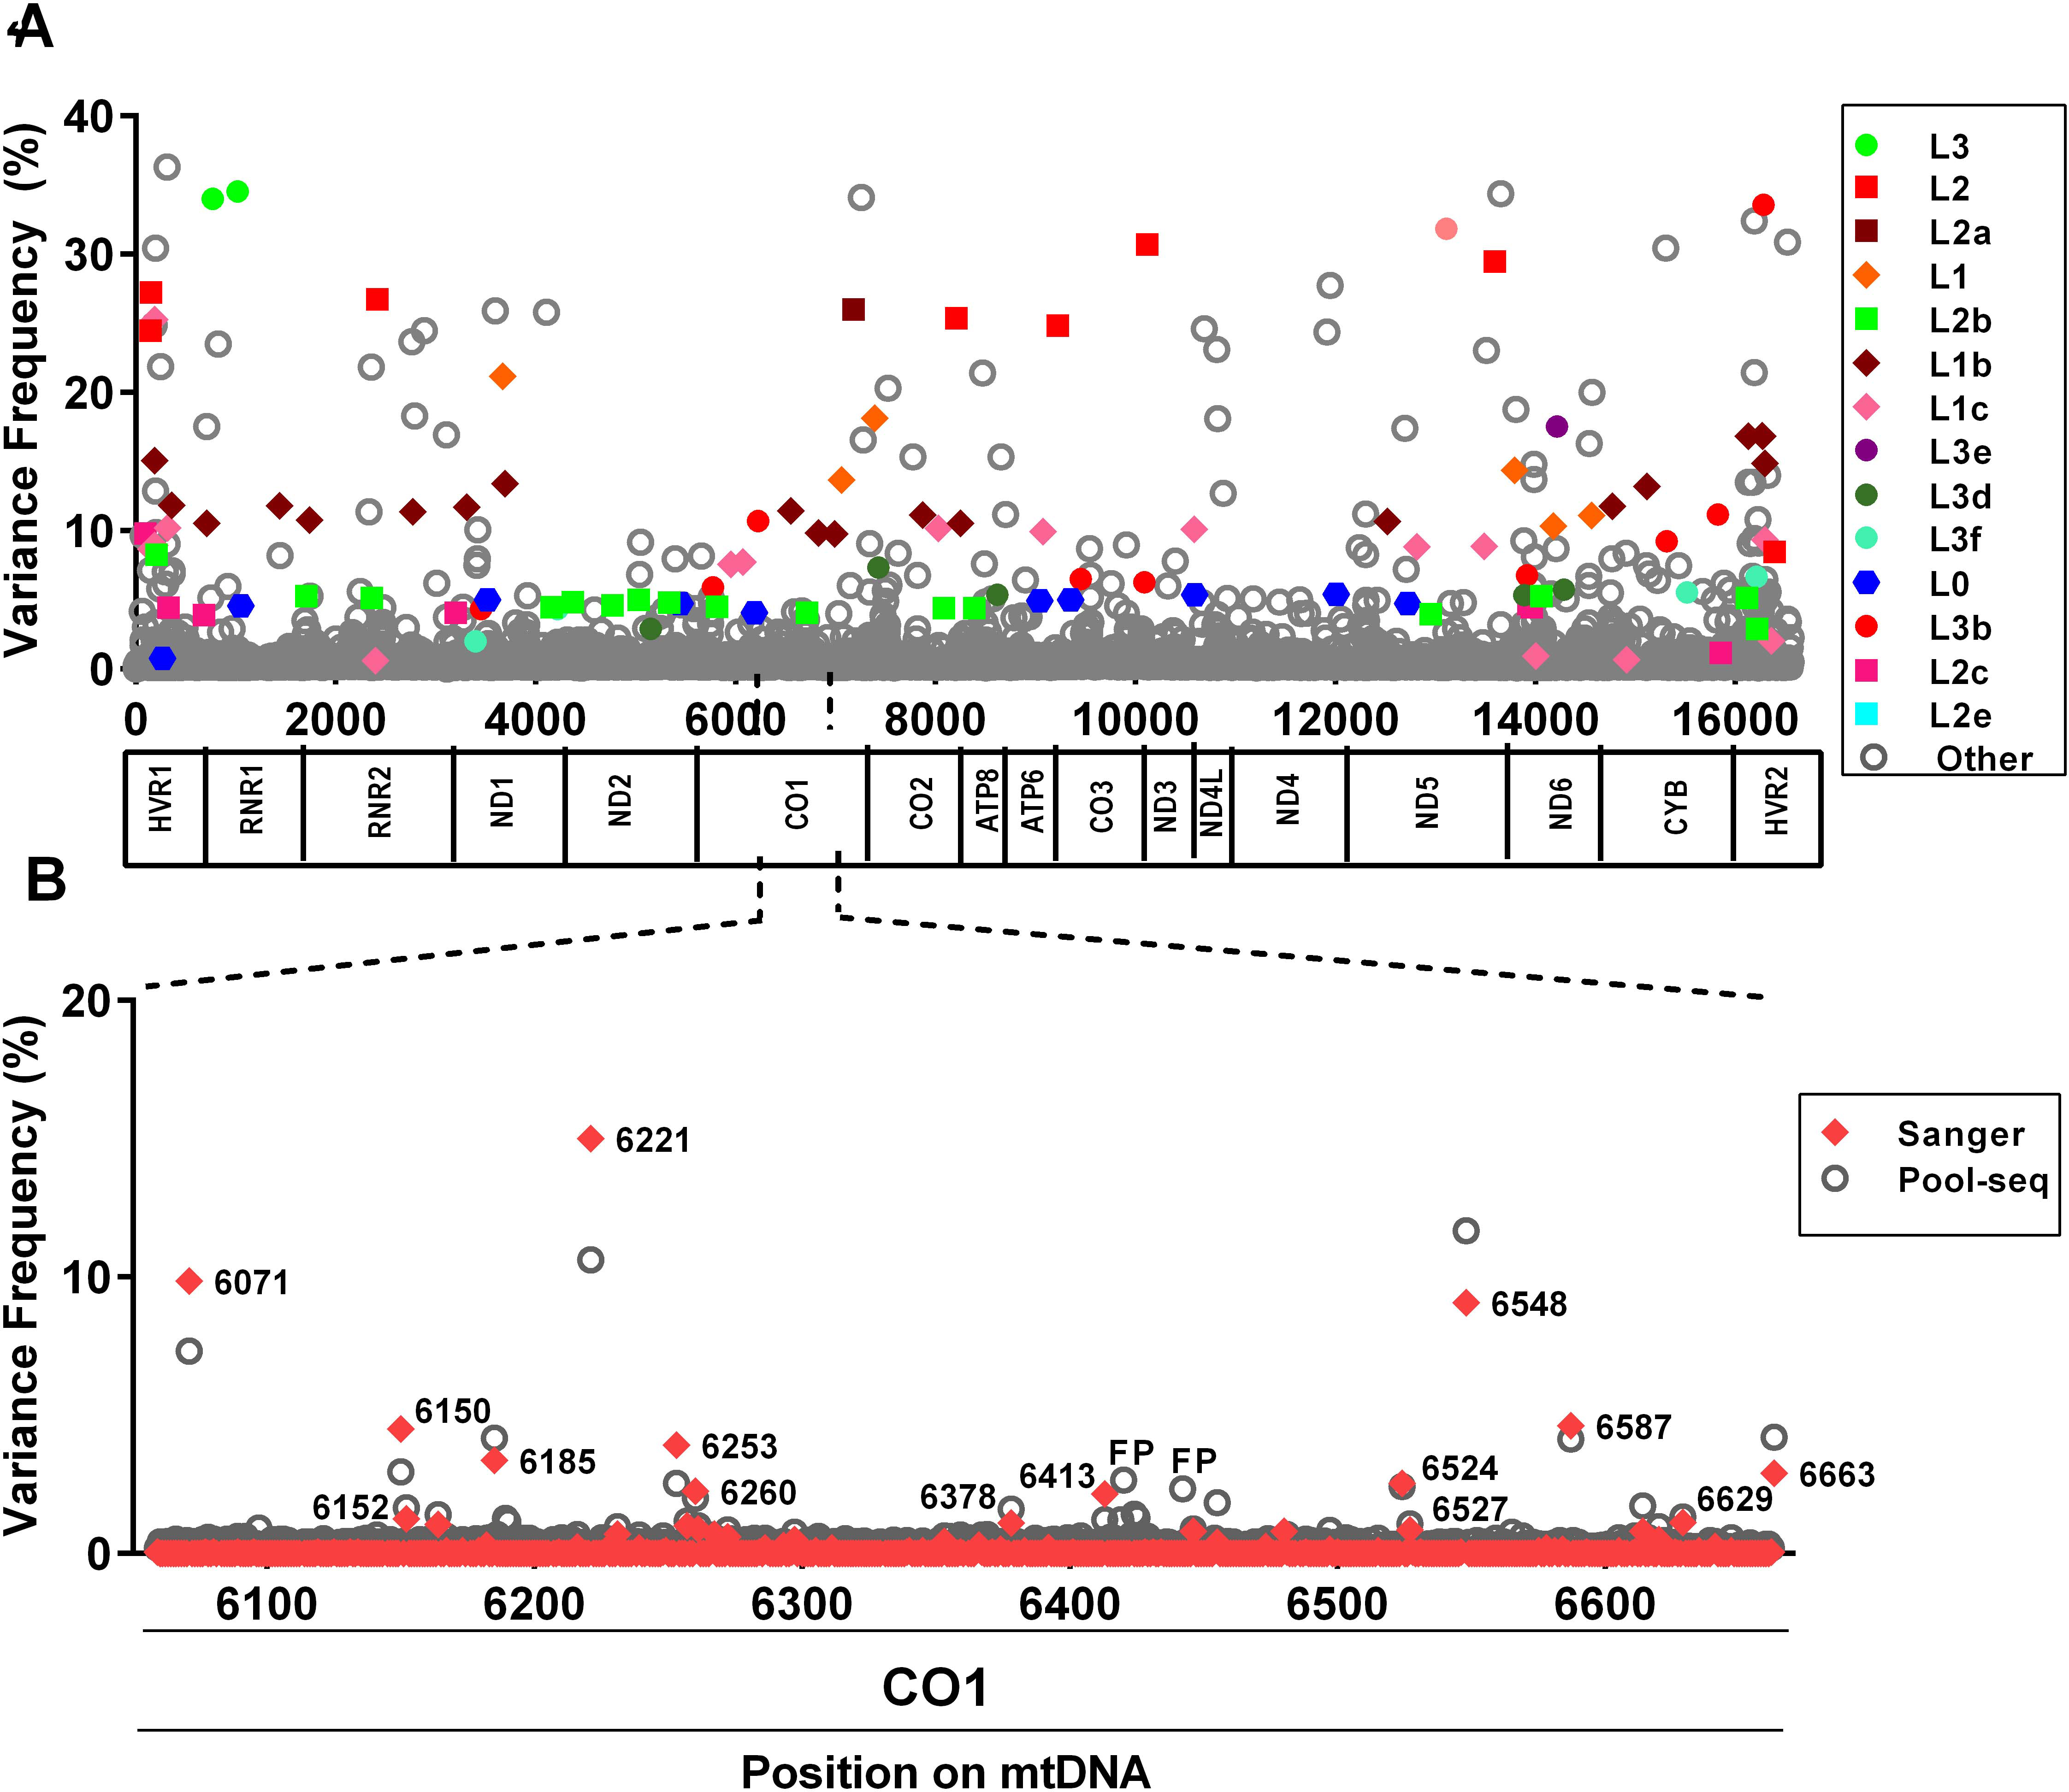
 Figure 2 of
Collins, Mol Vis 2016; 22:454-471.
Figure 2 of
Collins, Mol Vis 2016; 22:454-471.