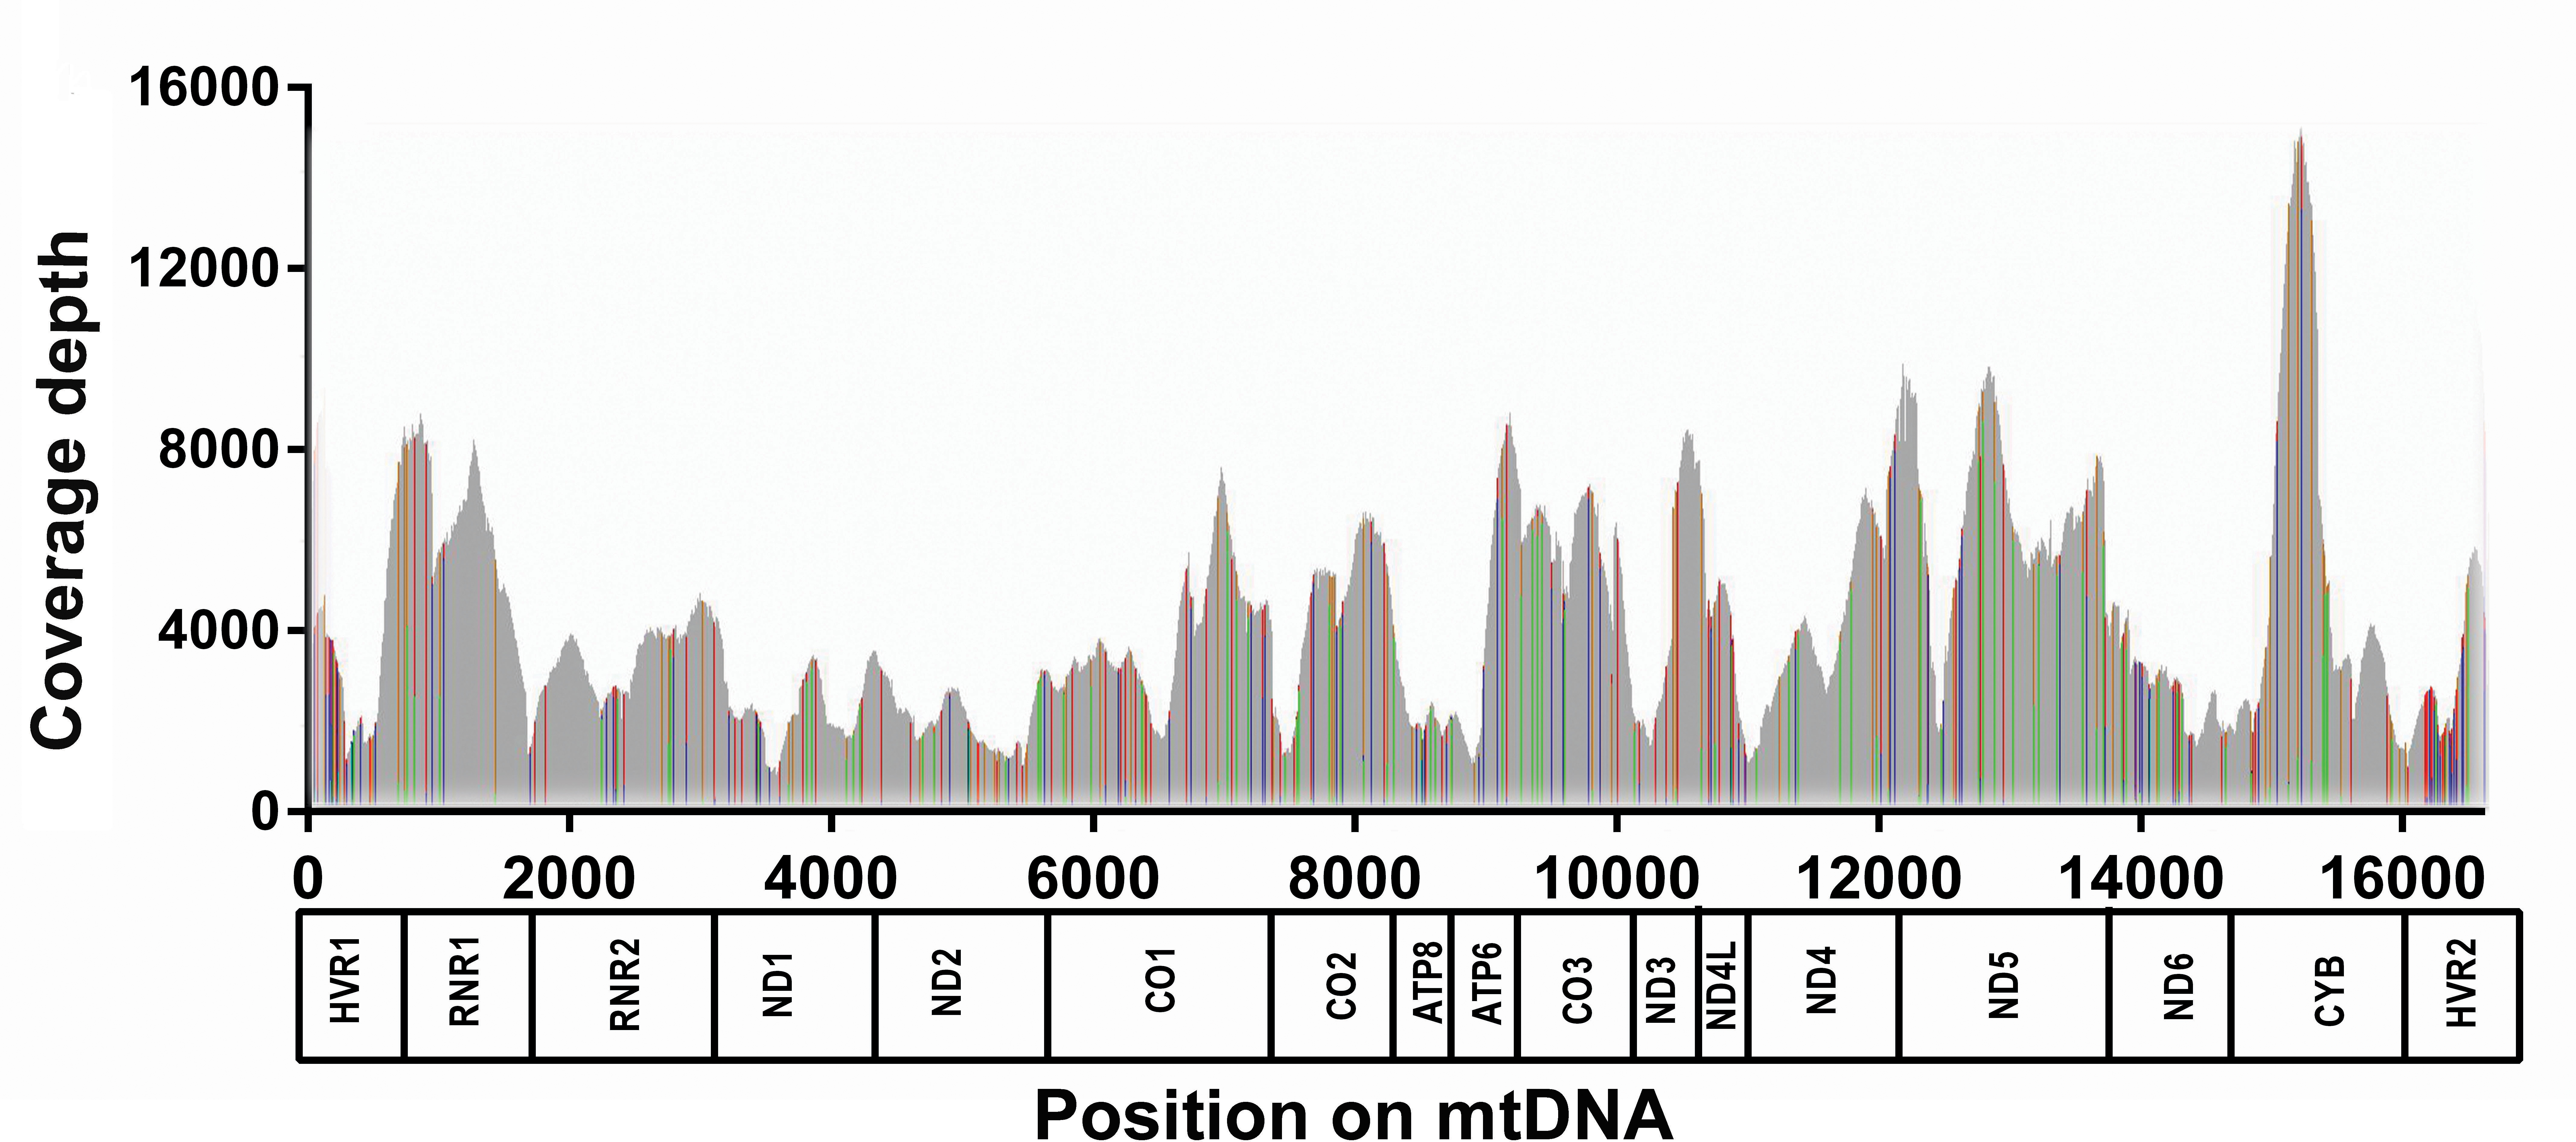
Figure 1. Complete coverage of mtDNA was obtained by Pool-seq. A representative IGV coverage map from one of the 43 DNA pools is shown,
with the positions of the major mitochondrial genes, and numbering corresponding to the rCRS mtDNA reference sequence. Positions
with a variance frequency higher than 3% are indicated by colored bars to indicate the base composition of the variable reads
(A=green, C=blue, G=brown, T=red), with coverage depth indicated by the height of each bar.

 Figure 1 of
Collins, Mol Vis 2016; 22:454-471.
  Figure 1 of
Collins, Mol Vis 2016; 22:454-471.