Figure 5. PGS activity in corneas of dry eye model rat. Fluorescein score (A) and PGS activity (B) of cornea in normal and dry eye rats (n = 10). C: PGS activity in corneal extract with or without 10 μM 2-OHE2 (n = 6). 2-OHE2 was added to the assay buffer. Results are
expressed as mean ± S.D. t-test was used to determine the significance of differences. * and *** indicate a significant difference
from the result in normal (A, B) or dry eye group (C), p< 0.05 and p< 0.005, respectively.
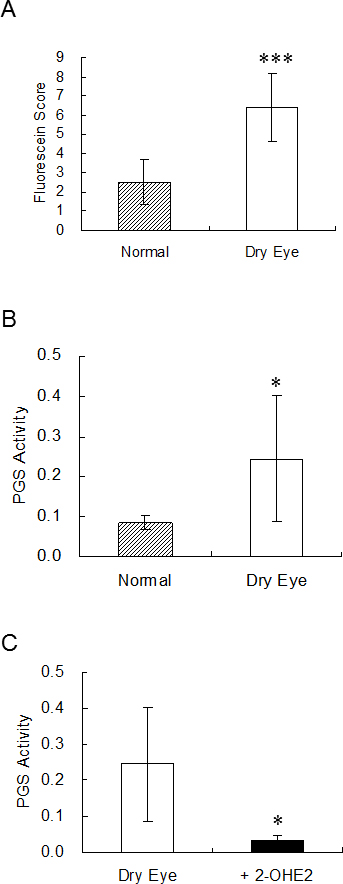
 Figure 5 of
Higuchi, Mol Vis 2016; 22:446-453.
Figure 5 of
Higuchi, Mol Vis 2016; 22:446-453.