Figure 4 of
Higuchi, Mol Vis 2016; 22:446-453.
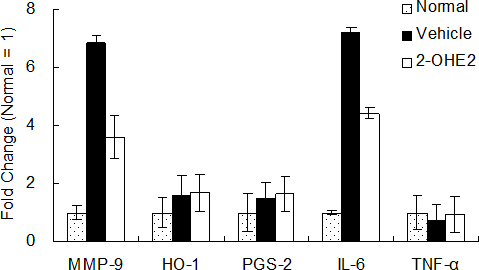
Figure 4.
Fold change of mRNA expression in cornea. The vertical axis shows fold change calculated from ΔCt value (
Table 1
). Fold change of normal group defined as 1. Results are expressed as the mean ± SD (n = 6).
 Figure 4 of
Higuchi, Mol Vis 2016; 22:446-453.
Figure 4 of
Higuchi, Mol Vis 2016; 22:446-453.