Figure 3. Effects of 2-OHE2 eye drops on the cornea of a dry eye rat model. Photo of cornea stained by fluorescein. A: PBS treatment, B: 2-OHE2 eye drops. C, D: Fluorescein score of cornea (C) and tear volume (D) in normal, vehicle, and 2-OHE2 groups (n = 10). Results are expressed as mean ± S.D. Dunnett’s test was used to determine
the significance of differences. * and *** indicate a significant difference from the result in vehicle group, p< 0.05 and
p< 0.005, respectively.
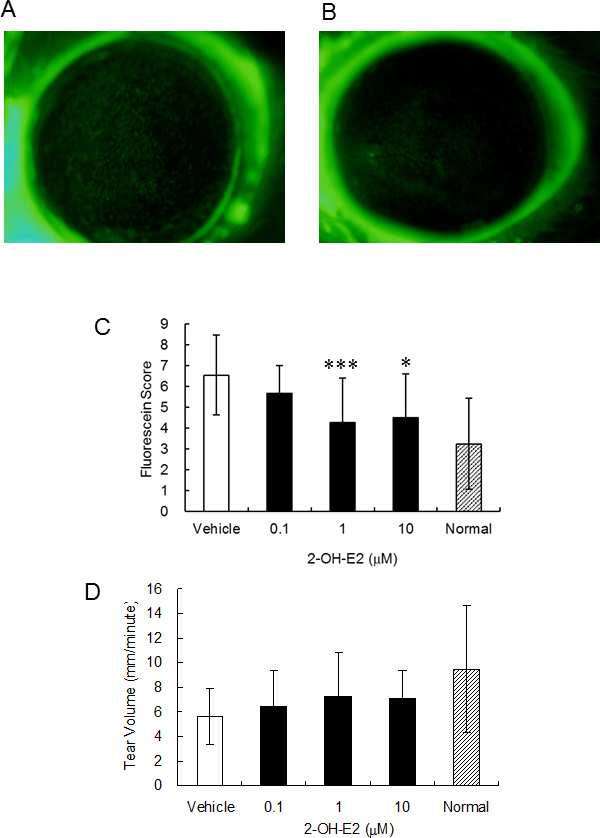
 Figure 3 of
Higuchi, Mol Vis 2016; 22:446-453.
Figure 3 of
Higuchi, Mol Vis 2016; 22:446-453.