Figure 2. Suppression of PGS activity in CEPI cells by steroids. A: Effect of 2-OHE2 on cellular viability. The horizontal axis shows the concentration of 2-OHE2 added to the medium, and the
vertical axis shows the cellular viability in CEPI cells. B: The PGS activity of the cellular extract of CEPI cells with or without 10 μM steroids. NT, E2, or T means without a steroid,
estradiol, or testosterone addition. The vertical axis shows the PGS activity ratio. The results are expressed as mean ± SD.
Dunnett’s test was used to determine the significance of differences. * indicates a significant difference from the result
in NT, p<0.05.
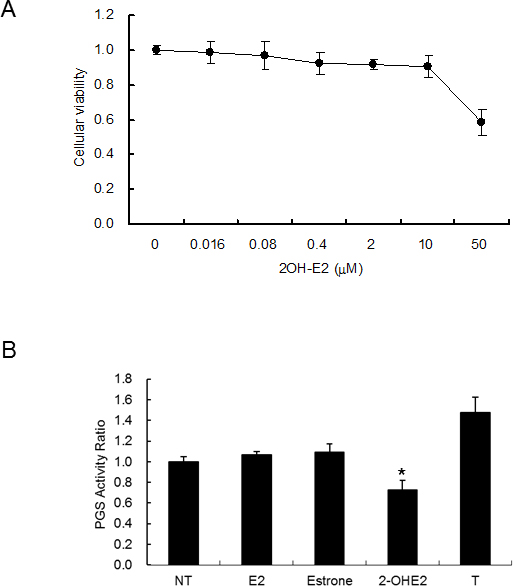
 Figure 2 of
Higuchi, Mol Vis 2016; 22:446-453.
Figure 2 of
Higuchi, Mol Vis 2016; 22:446-453.