Figure 4. Effect of tenascin-C on human retinal endothelial cells (HRECs) in culture. A: Cell proliferation assay of HRECs. Bromodeoxyuridine (BrdU) incorporation (n = 4 per group) was measured in the presence
of varying concentrations of tenascin-C (30, 100, and 300 ng/ml). *p <0.05, **p <0.01, compared to control. B: Cellular migration assay of HRECs. HRECs were placed in the upper chamber and allowed to migrate toward the lower side of
the insert coated with tenascin-C, fibronectin, or BSA (25 μg/ml each). The photographs were taken (20× objective) after Hoechst
33342 staining. *p<0.001, compared to control. C: Matrigel tube formation assay of HRECs. The network formation with HRECs was quantified by the total numbers of master junctions,
master segments, or meshes in the presence of varying concentrations of tenascin-C (30, 100, and 300 ng/ml). *p <0.05, **p
<0.01, compared to control. Bars are mean ± standard error of the mean (SEM, n = 4-6 per group).
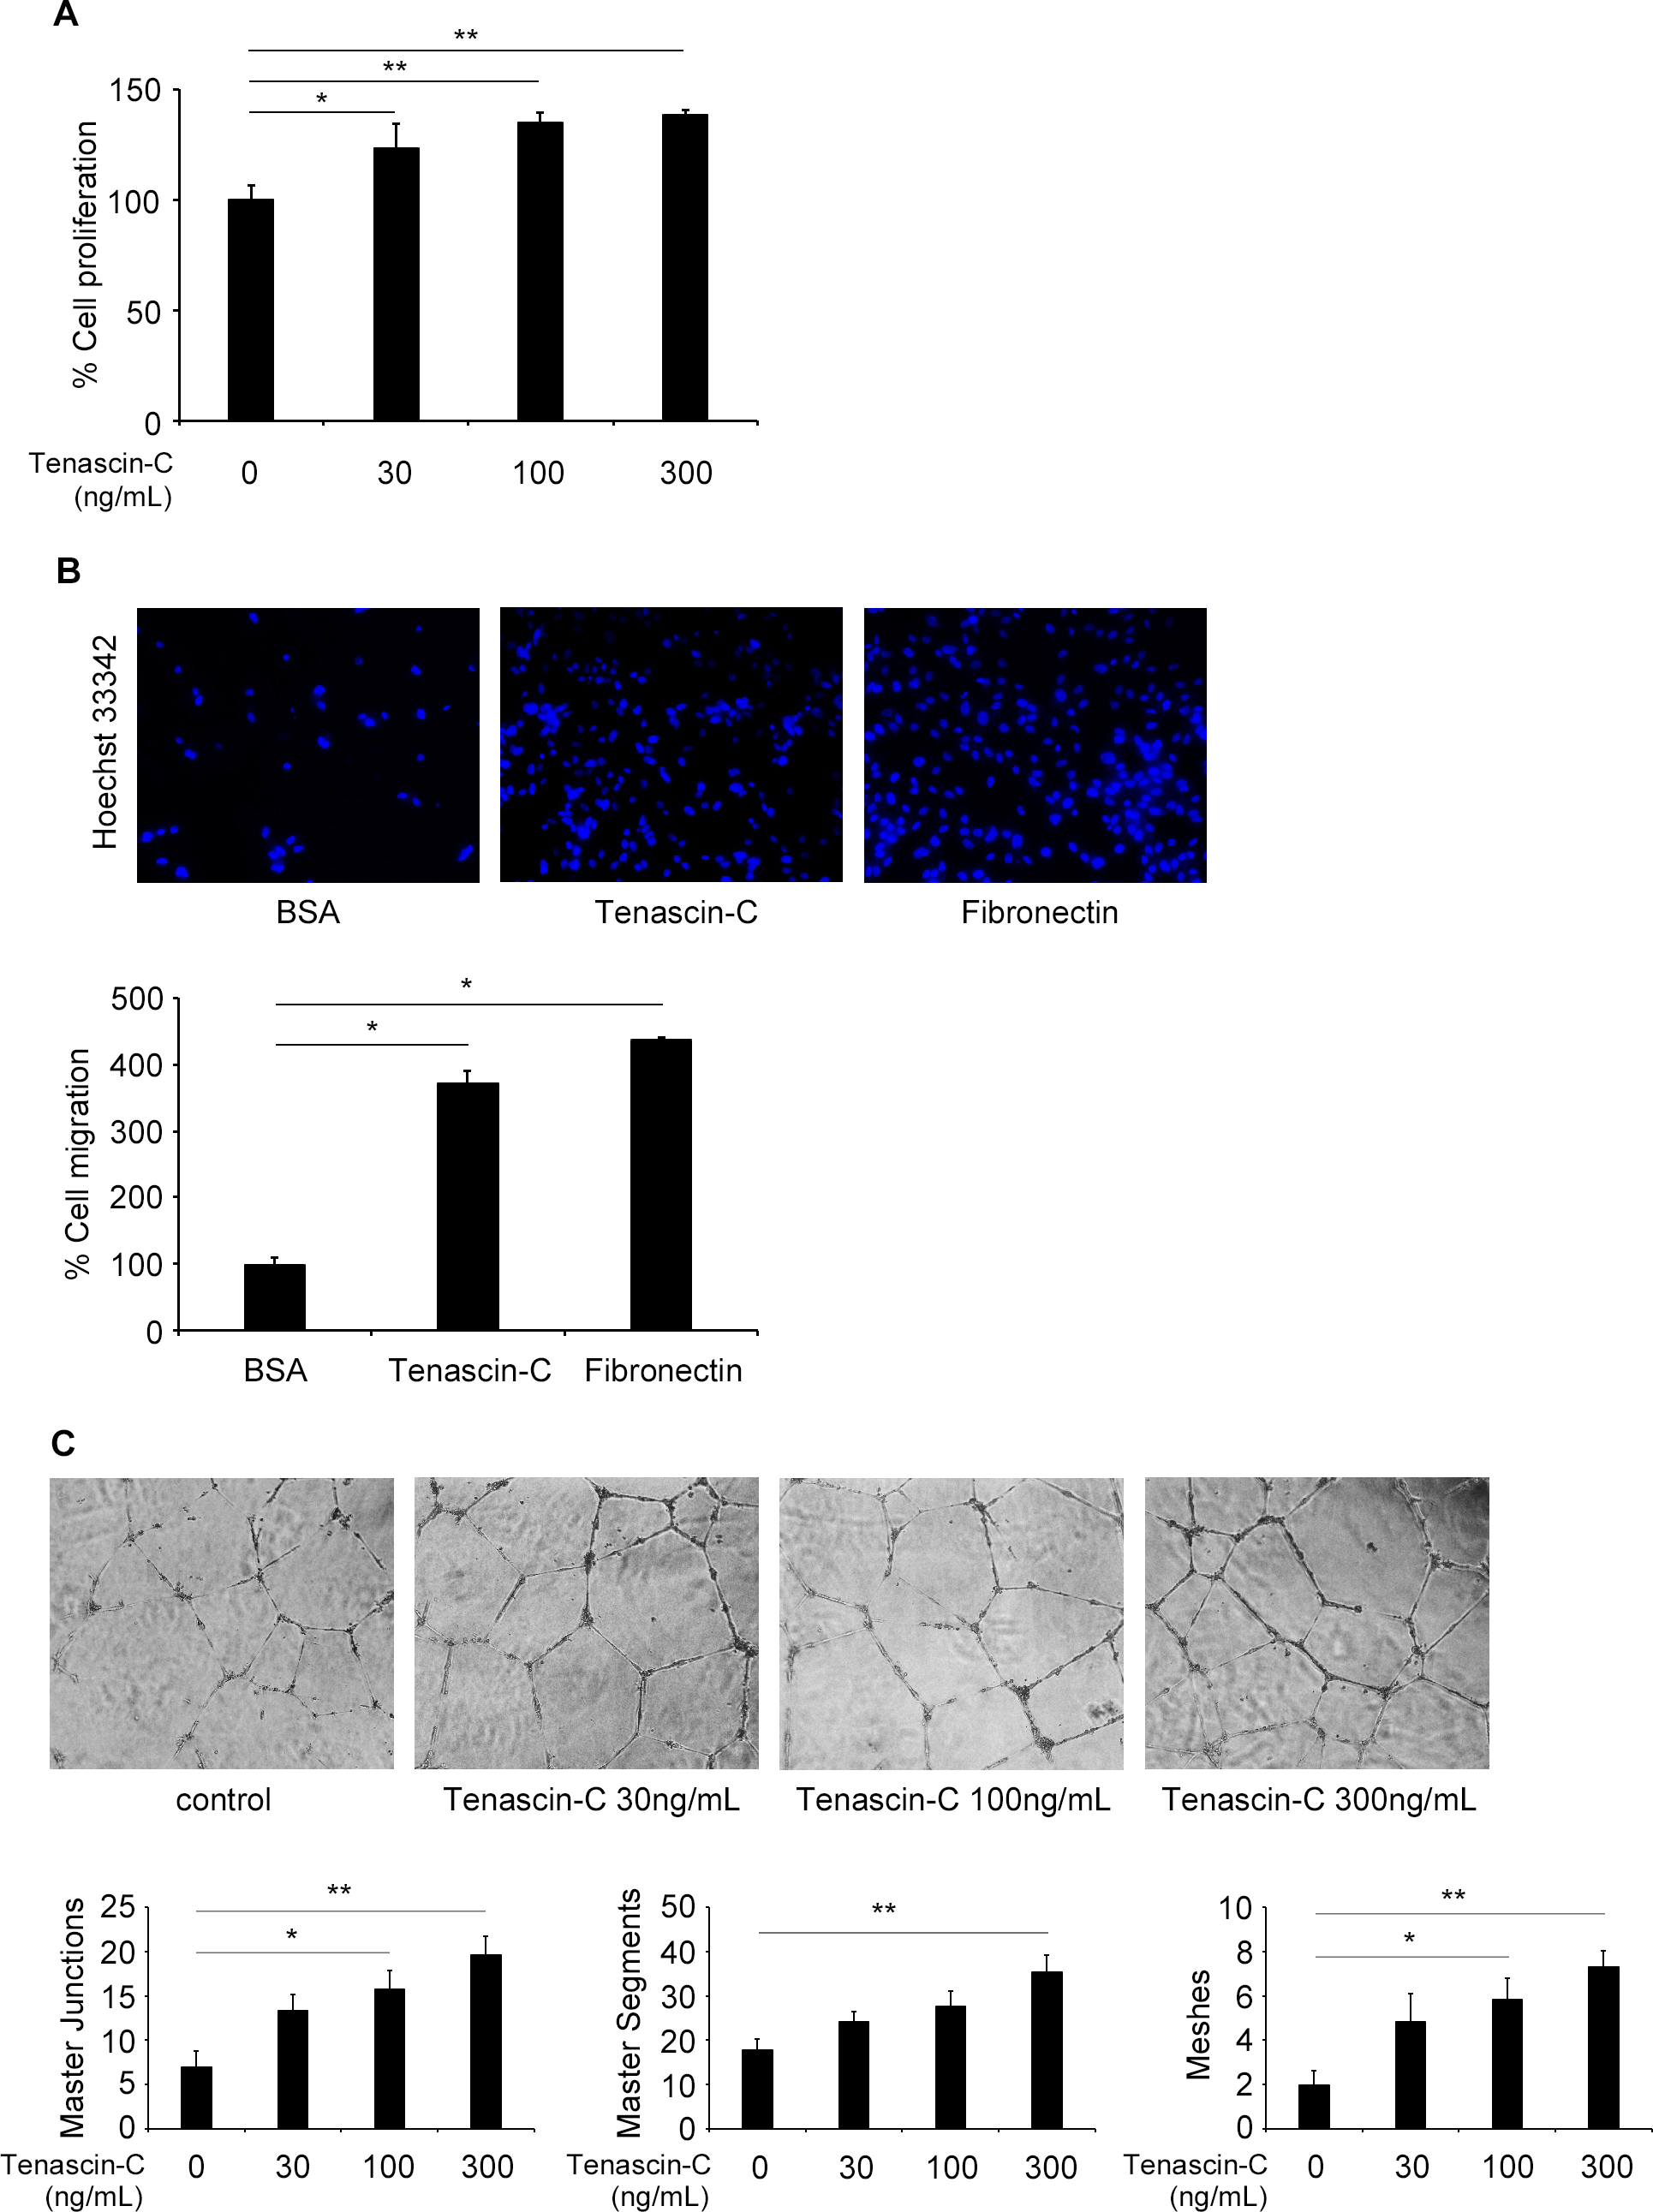
 Figure 4 of
Kobayashi, Mol Vis 2016; 22:436-445.
Figure 4 of
Kobayashi, Mol Vis 2016; 22:436-445.