Figure 1. The expression levels of tissue factor (TF) and tissue factor pathway inhibitor (TFPI) in equal volumes (15 µl) of vitreous
fluid samples obtained from patients with proliferative diabetic retinopathy (PDR; n=12) and from control patients without
diabetes (RD; n=12) were determined with Western blot analysis. A representative set of samples is shown. The resultant data
are presented in the histograms as mean ± standard deviation. The expressions of TF (A) and both intact and cleaved TFPI (B) are significantly increased in vitreous samples from PDR patients compared to control patients without diabetes. *The difference
between the two means was statistically significant at the 5% level of significance (p=0.0001; p=0.0001; p=0.01, respectively;
Mann-Whitney test).
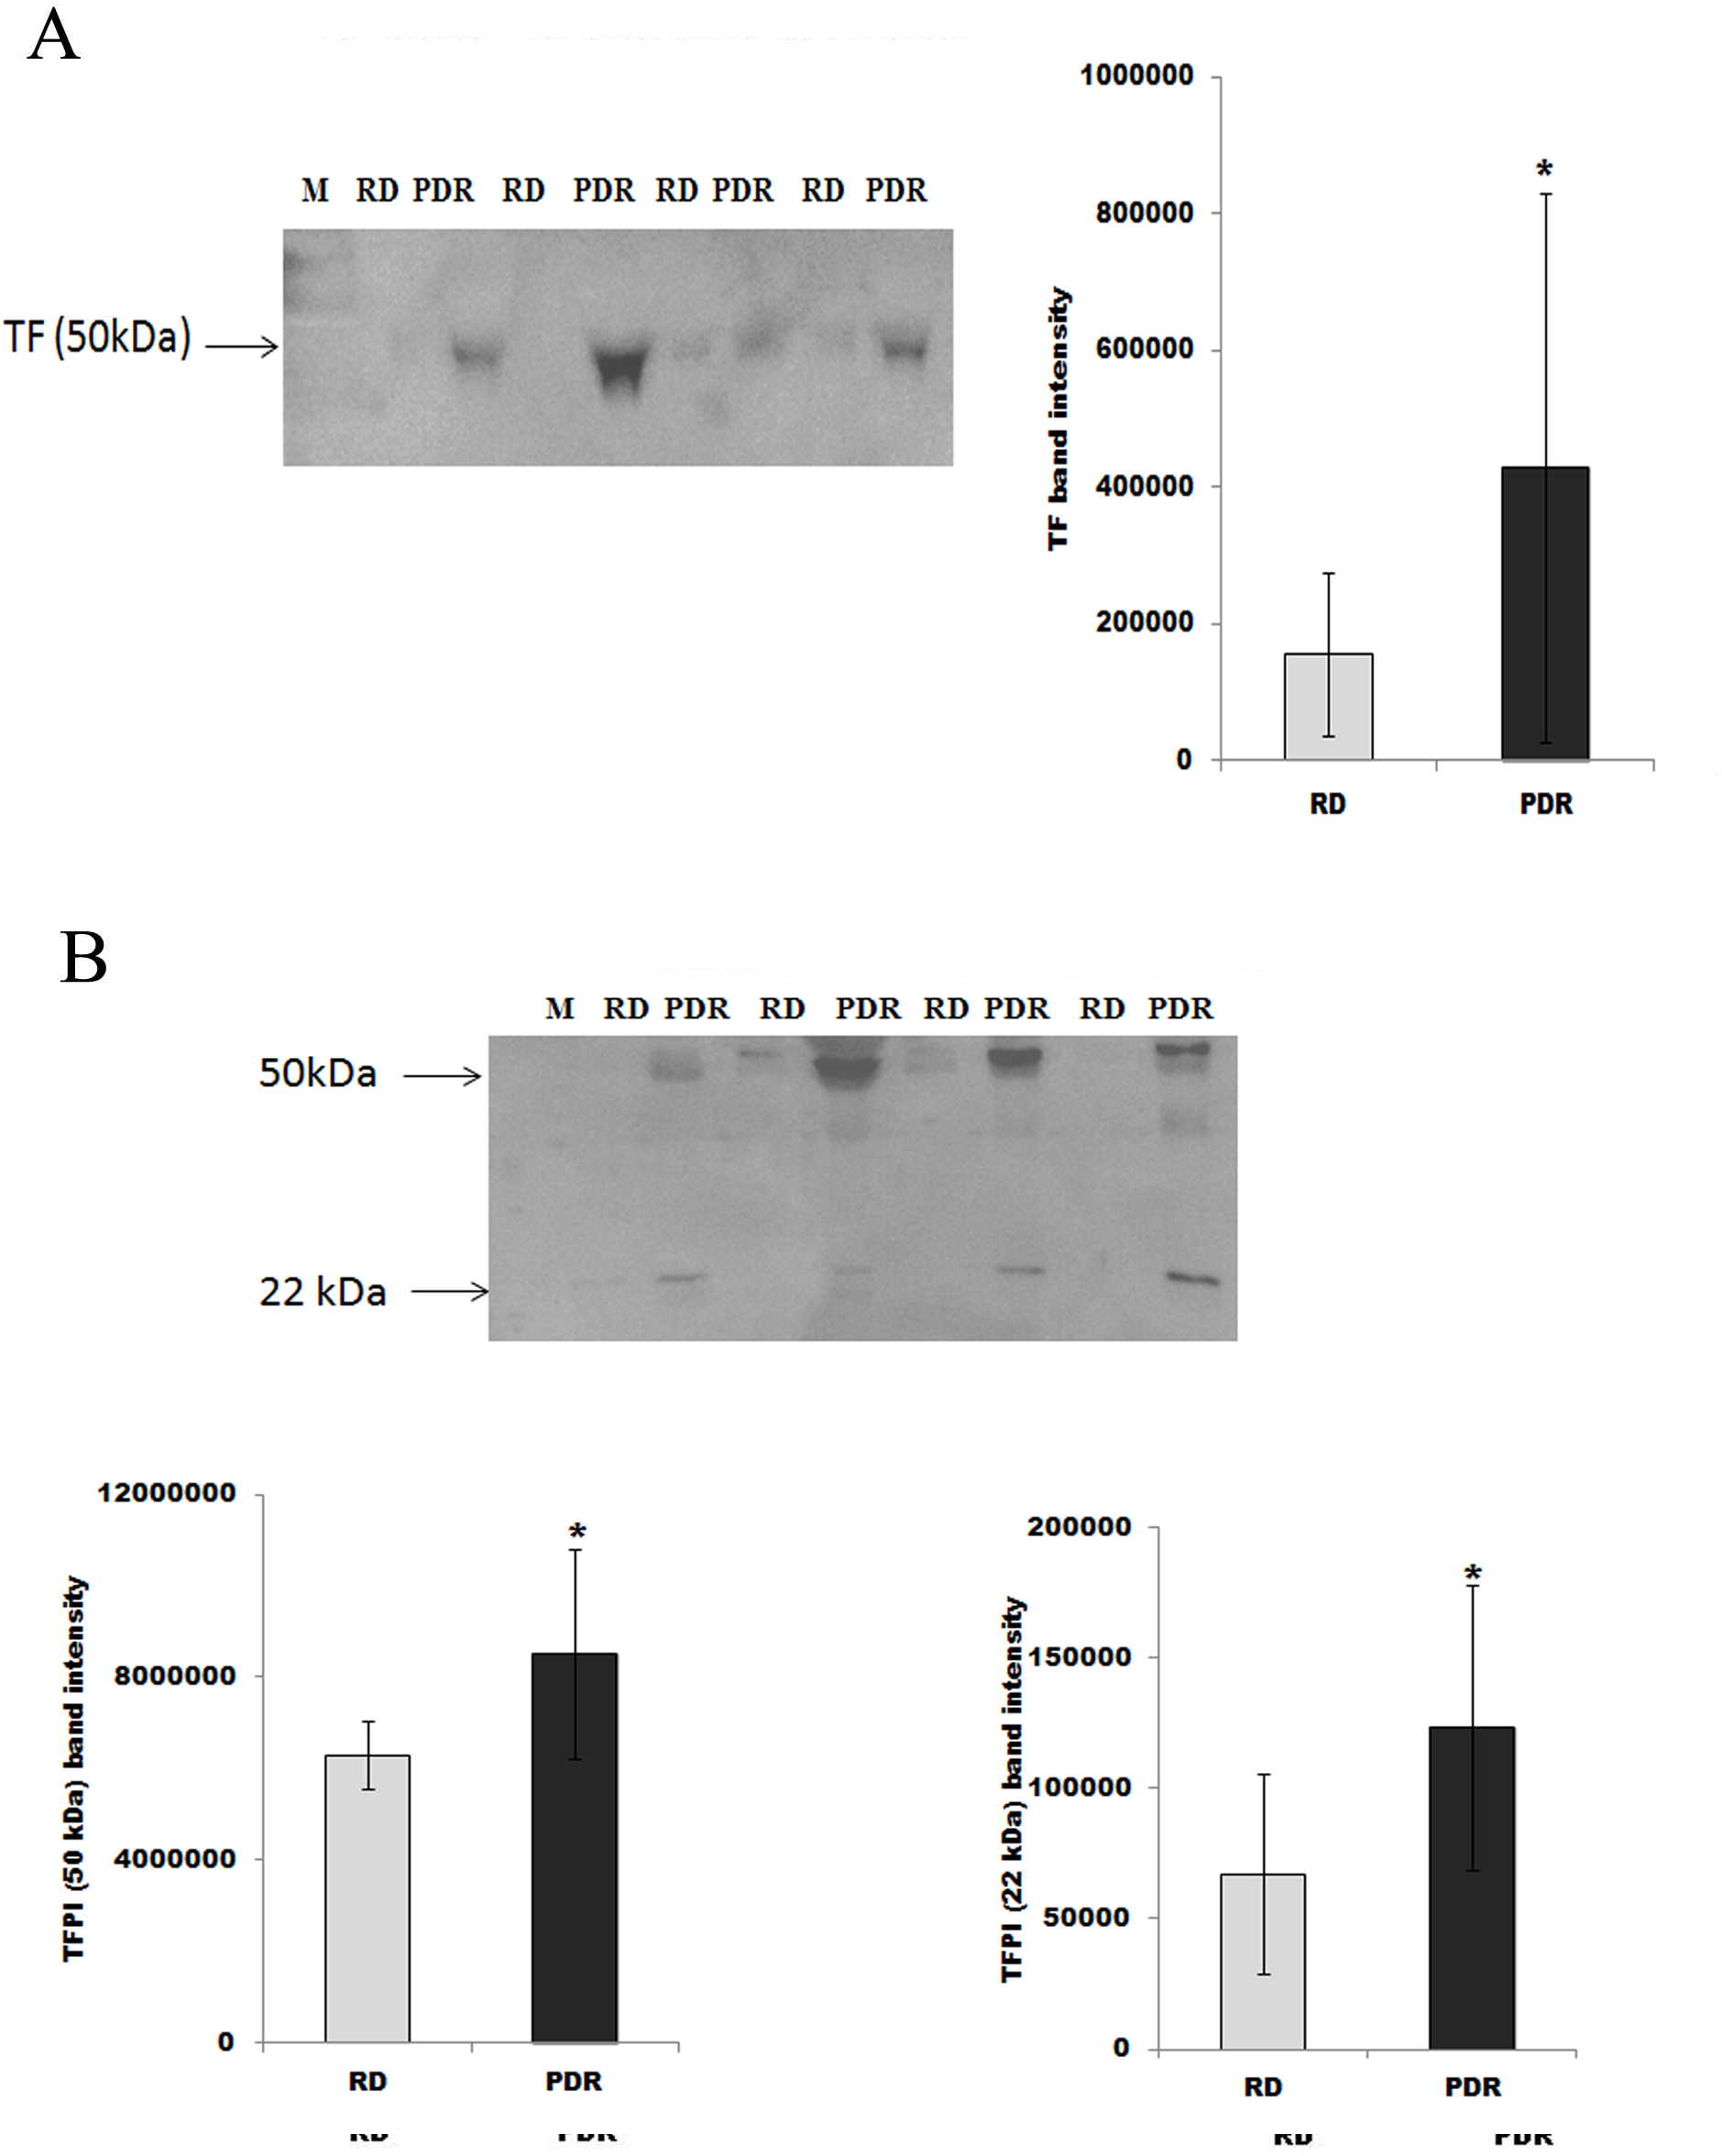
 Figure 1 of
Abu El-Asrar, Mol Vis 2016; 22:424-435.
Figure 1 of
Abu El-Asrar, Mol Vis 2016; 22:424-435.