Figure 9. In vitro study on Wistar rat lenses cultured for 24 h in Dulbecco’s modified Eagle’s medium: Immunoblot studies. A: Immunoblots showing differential staining intensity of some apoptotic cascade proteins in the three groups of lenses. B: Bar graphs of mean normalized densitometric readings of some apoptotic cascade proteins in the three groups of lenses. Groups
of lenses; Group I: Normal lenses incubated in Dulbecco’s modified Eagle’s medium (DMEM) alone (control); Group II: Lenses
incubated in DMEM that contained sodium selenite (100 μM selenite/ml of DMEM; selenite-challenged, untreated); Group IIIa:
Lenses incubated in DMEM and simultaneously exposed to sodium selenite (100 μM selenite/ml of DMEM) and chrysin (200 μM chrysin/ml
of DMEM; selenite-challenged simultaneously chrysin-treated). Statistical analysis of values derived by densitometric scanning
of the immunoblots (values shown as a bar diagram to below the immunoblots). Values represent the mean ± standard deviation
(SD) of the band intensity (densitometric reading) of each protein (experiments run in triplicate). Statistical analysis was
one-way ANOVA with post hoc testing (least significant difference). aStatistically significant difference (p<0.05) when compared with the Group I values. bStatistically significant difference (p<0.05) when compared with the Group II values. Abbreviations: EGR-1=early growth response
protein-1; COX-1=cytochrome c oxidase-1.
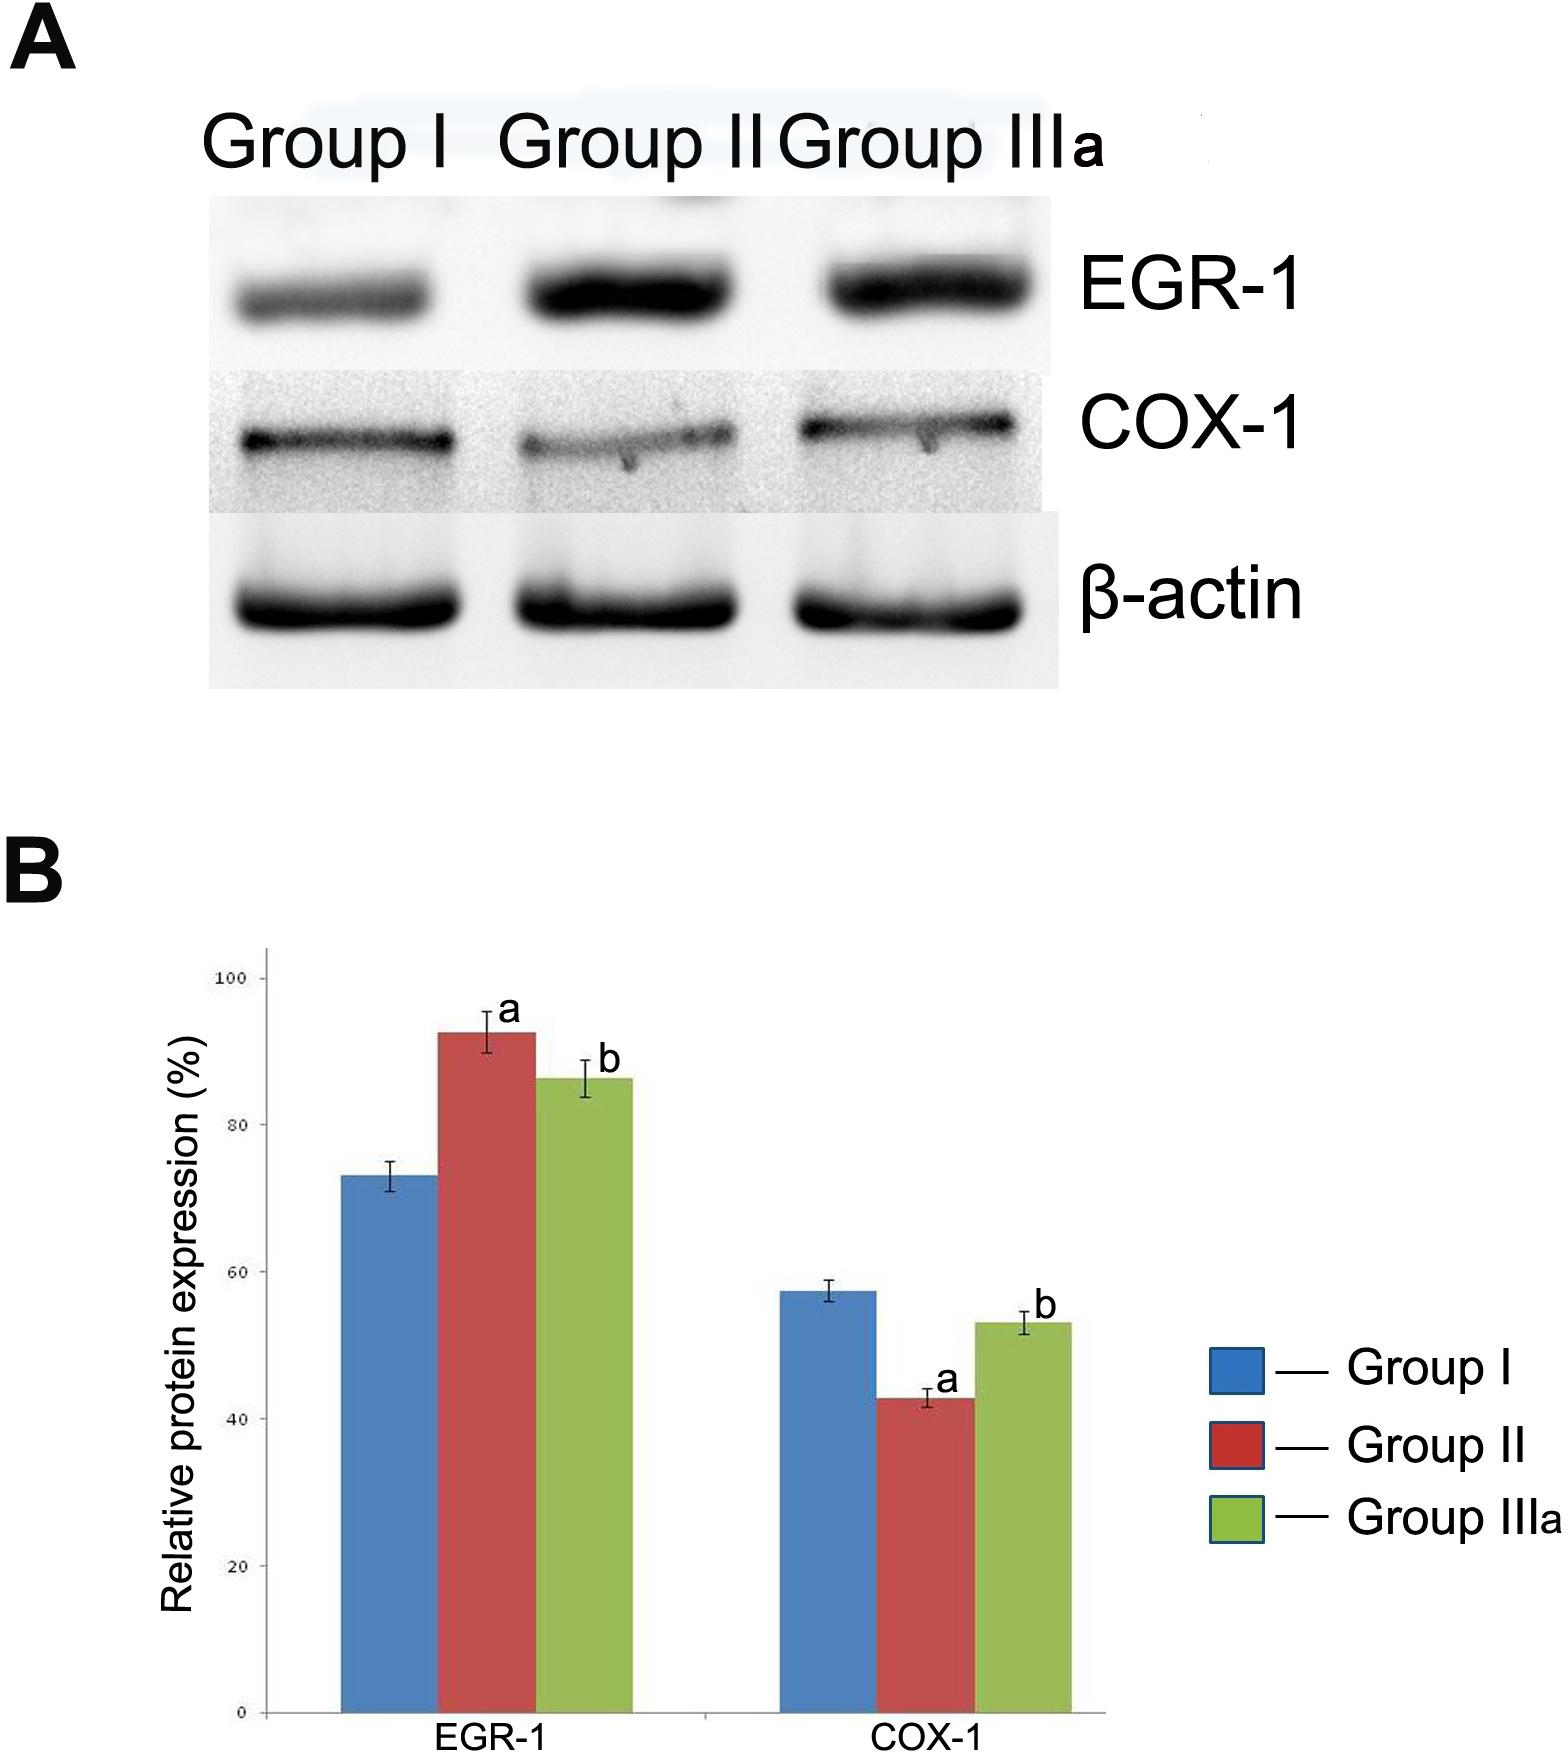
 Figure 9 of
Sundararajan, Mol Vis 2016; 22:401-423.
Figure 9 of
Sundararajan, Mol Vis 2016; 22:401-423.