Figure 7. In vitro study on Wistar rat lenses cultured for 24 h in Dulbecco’s modified Eagle’s medium: Effect of chrysin on calpain
activity. A: Mean lenticular activity of calpain. Groups of lenses; Group I: Normal lenses incubated in Dulbecco’s modified Eagle’s medium
(DMEM) alone (control); Group II: Lenses incubated in DMEM that contained sodium selenite (100 μM selenite/ml of DMEM; selenite-challenged,
untreated); Group IIIa: Lenses incubated in DMEM and simultaneously exposed to sodium selenite (100 μM selenite/ml of DMEM)
and chrysin (200 μM chrysin/ml of DMEM; selenite-challenged simultaneously chrysin-treated). Statistical analysis was one-way
ANOVA with post-hoc test (least significant difference). Values are expressed as the mean ± standard deviation (SD) of six
determinations. aStatistically significant difference (p<0.05) when compared with the Group I and III values. bStatistically significant difference (p<0.05) when compared with the Group II values. B: Analysis of casein zymography. Groups of lenses; Group I: Normal lenses incubated in Dulbecco’s modified Eagle’s medium
(DMEM) alone (control); Group II: Lenses incubated in DMEM that contained sodium selenite (100 μM selenite/ml of DMEM; selenite-challenged,
untreated); Group IIIa: Lenses incubated in DMEM and simultaneously exposed to sodium selenite (100 μM selenite/ml of DMEM)
and chrysin (200 μM chrysin/ml of DMEM; selenite-challenged simultaneously chrysin-treated). Statistical analysis of values
derived with densitometric scanning of the casein zymography (values shown as a bar diagram to the right of the casein zymogram)
and one-way ANOVA with the post-hoc test (least significant difference). Values are expressed as mean ± standard deviation
(SD) of six determinations. aStatistically significant difference (p<0.05) when compared with the Group I and III values. bStatistically significant difference (p<0.05) when compared with the Group II values. Abbreviations: GA=glutamic acid; Lp82=lenticular
preferred calpain 82.
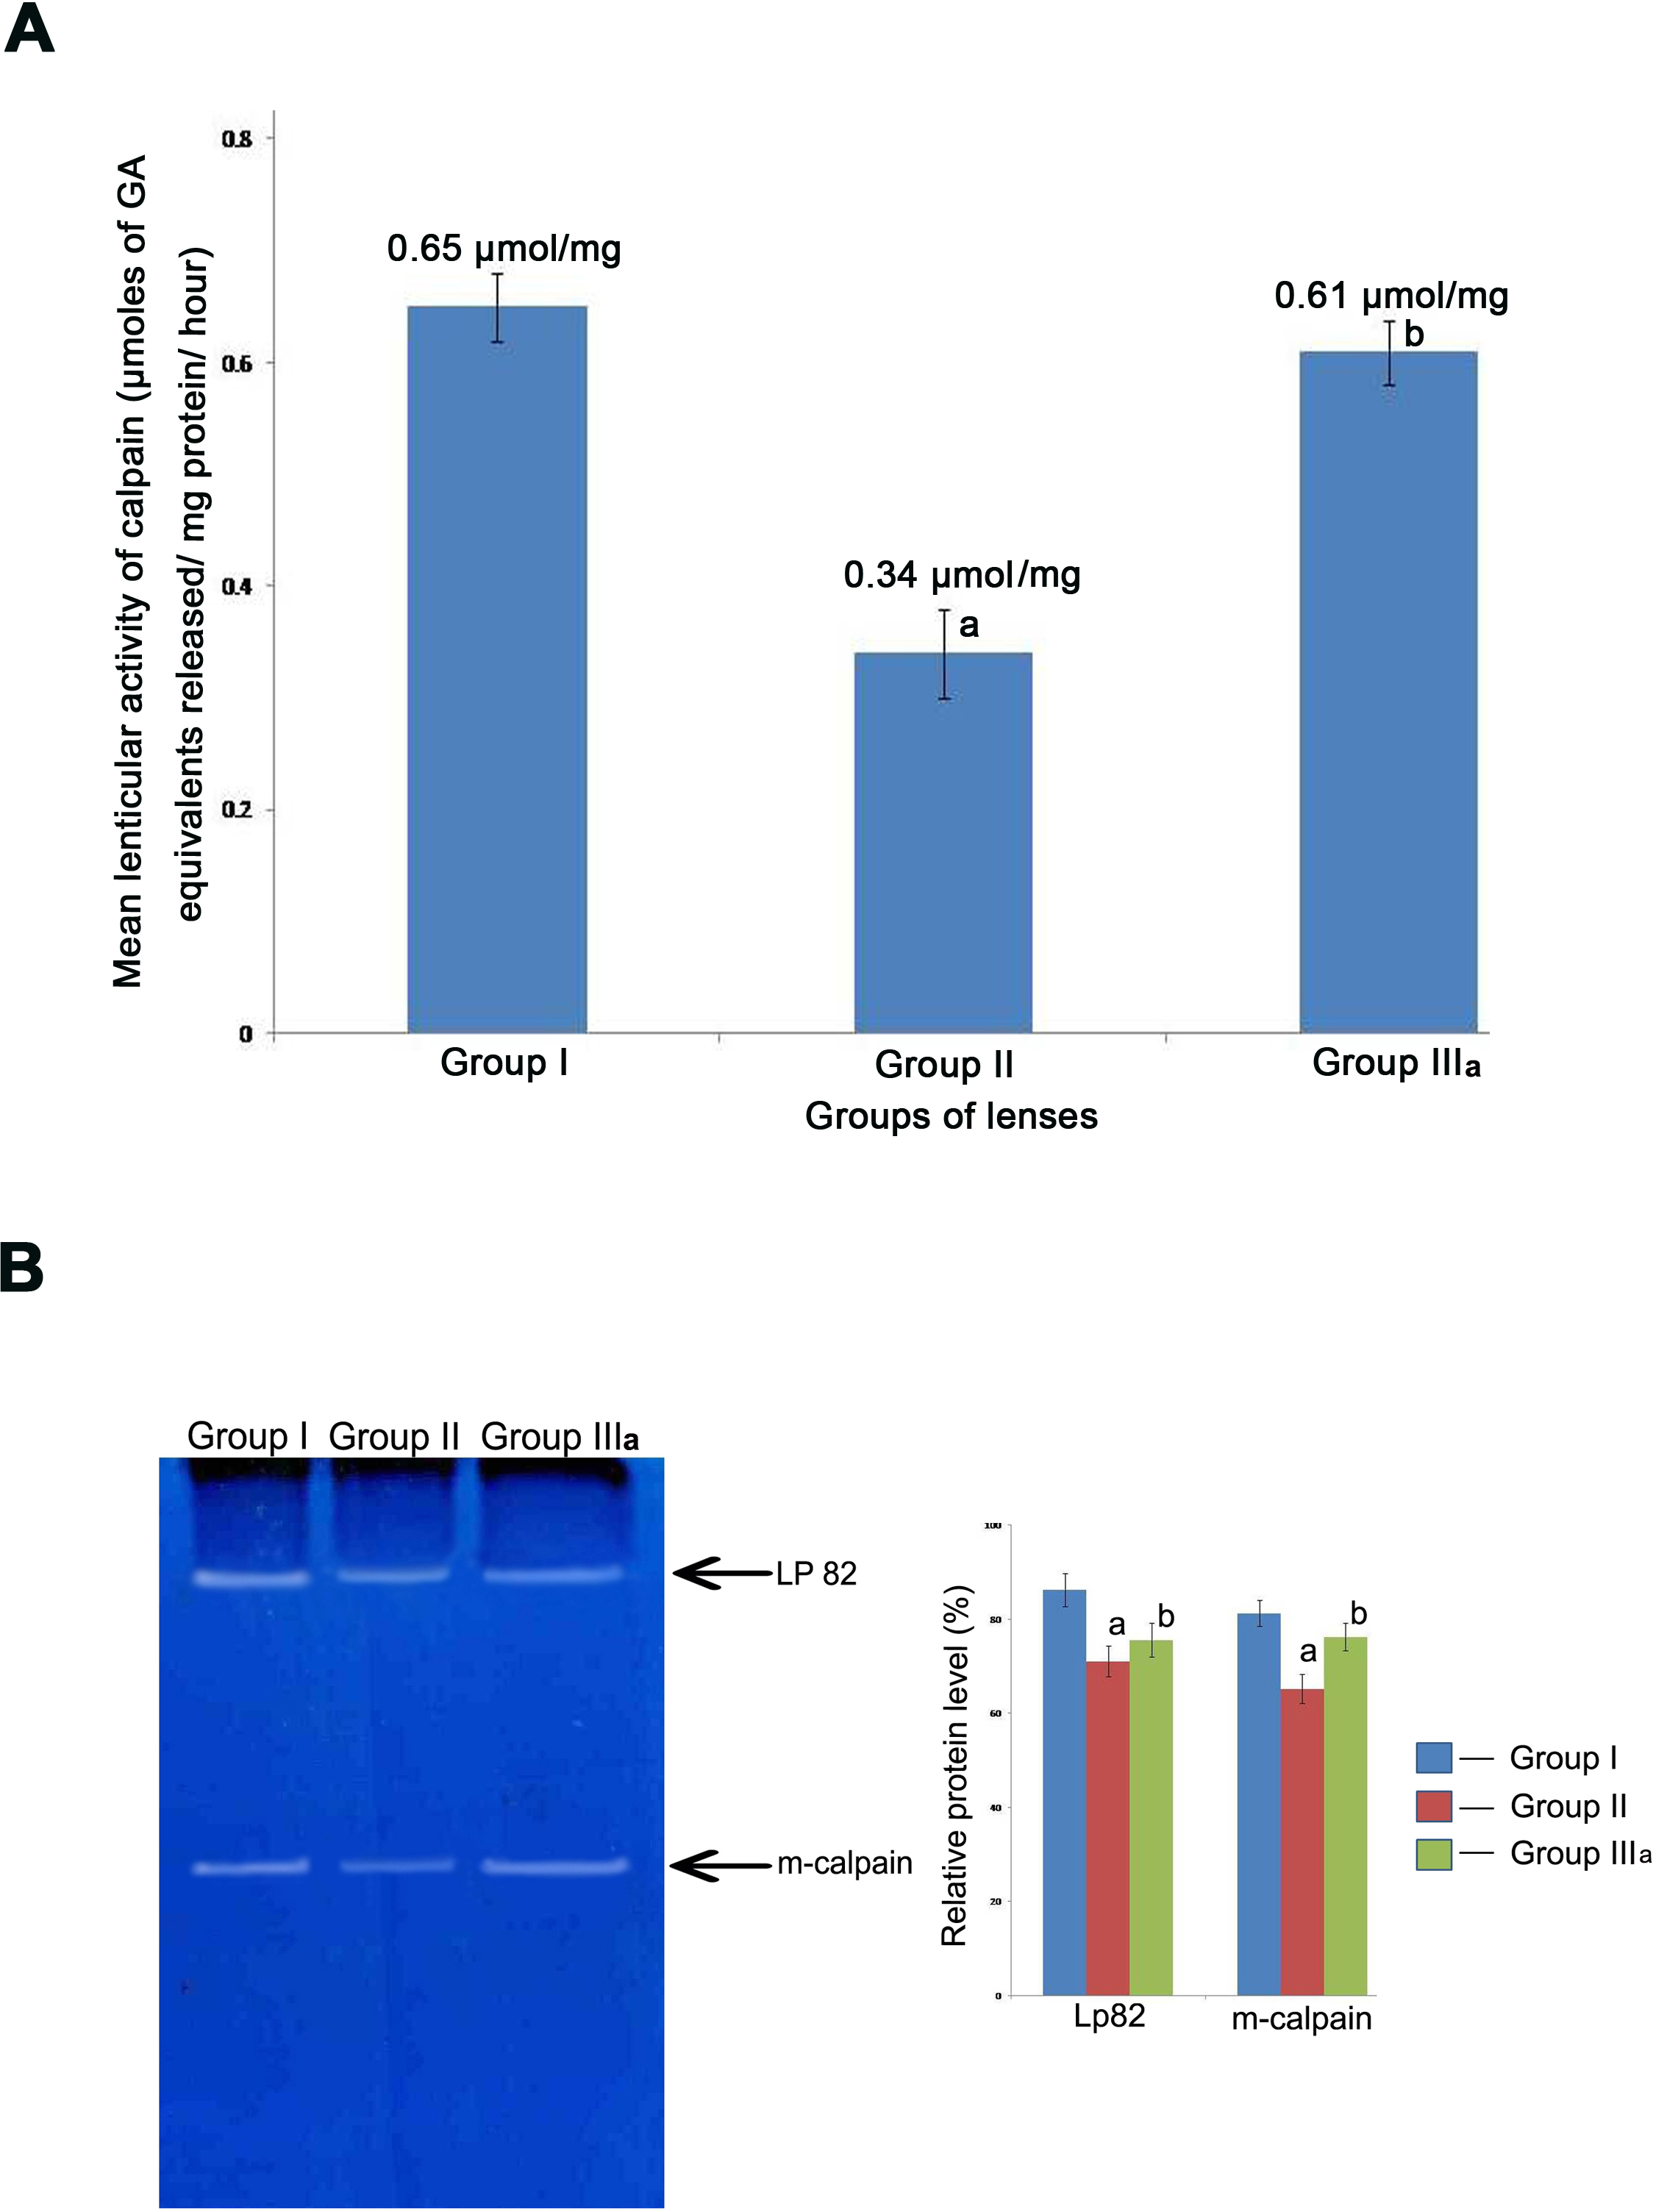
 Figure 7 of
Sundararajan, Mol Vis 2016; 22:401-423.
Figure 7 of
Sundararajan, Mol Vis 2016; 22:401-423.