Figure 3. Widespread changes in splicing events after PNN knockdown. A scatterplot of splicing events detected in pinin (PNN) knockdown
and control cells (the overlapping area in the Venn diagrams), plotting the mean expression (as log2 APN) of the control cells versus the PNN-knockdown cells. Differentially expressed events are red (upregulated) and blue
(downregulated), and non-differentially expressed events are in black. More than 70% of significantly different events are
upregulated in PNN (p<0.0001). All types of events are biased toward upregulation in PNN (92.5% of all events, 91.8% of exon-skipping
events (635 of 692 differentially expressed [DE] events), 94.1% of alternative donor sites (531 of 564 DE events), 93.0% of
alternative receptor sites (490 of 527 DE events), 93.7% of events involving alternative donors and acceptors (554 of 591
DE events), and 62.9% of intron retention events (95 of 151 DE events).
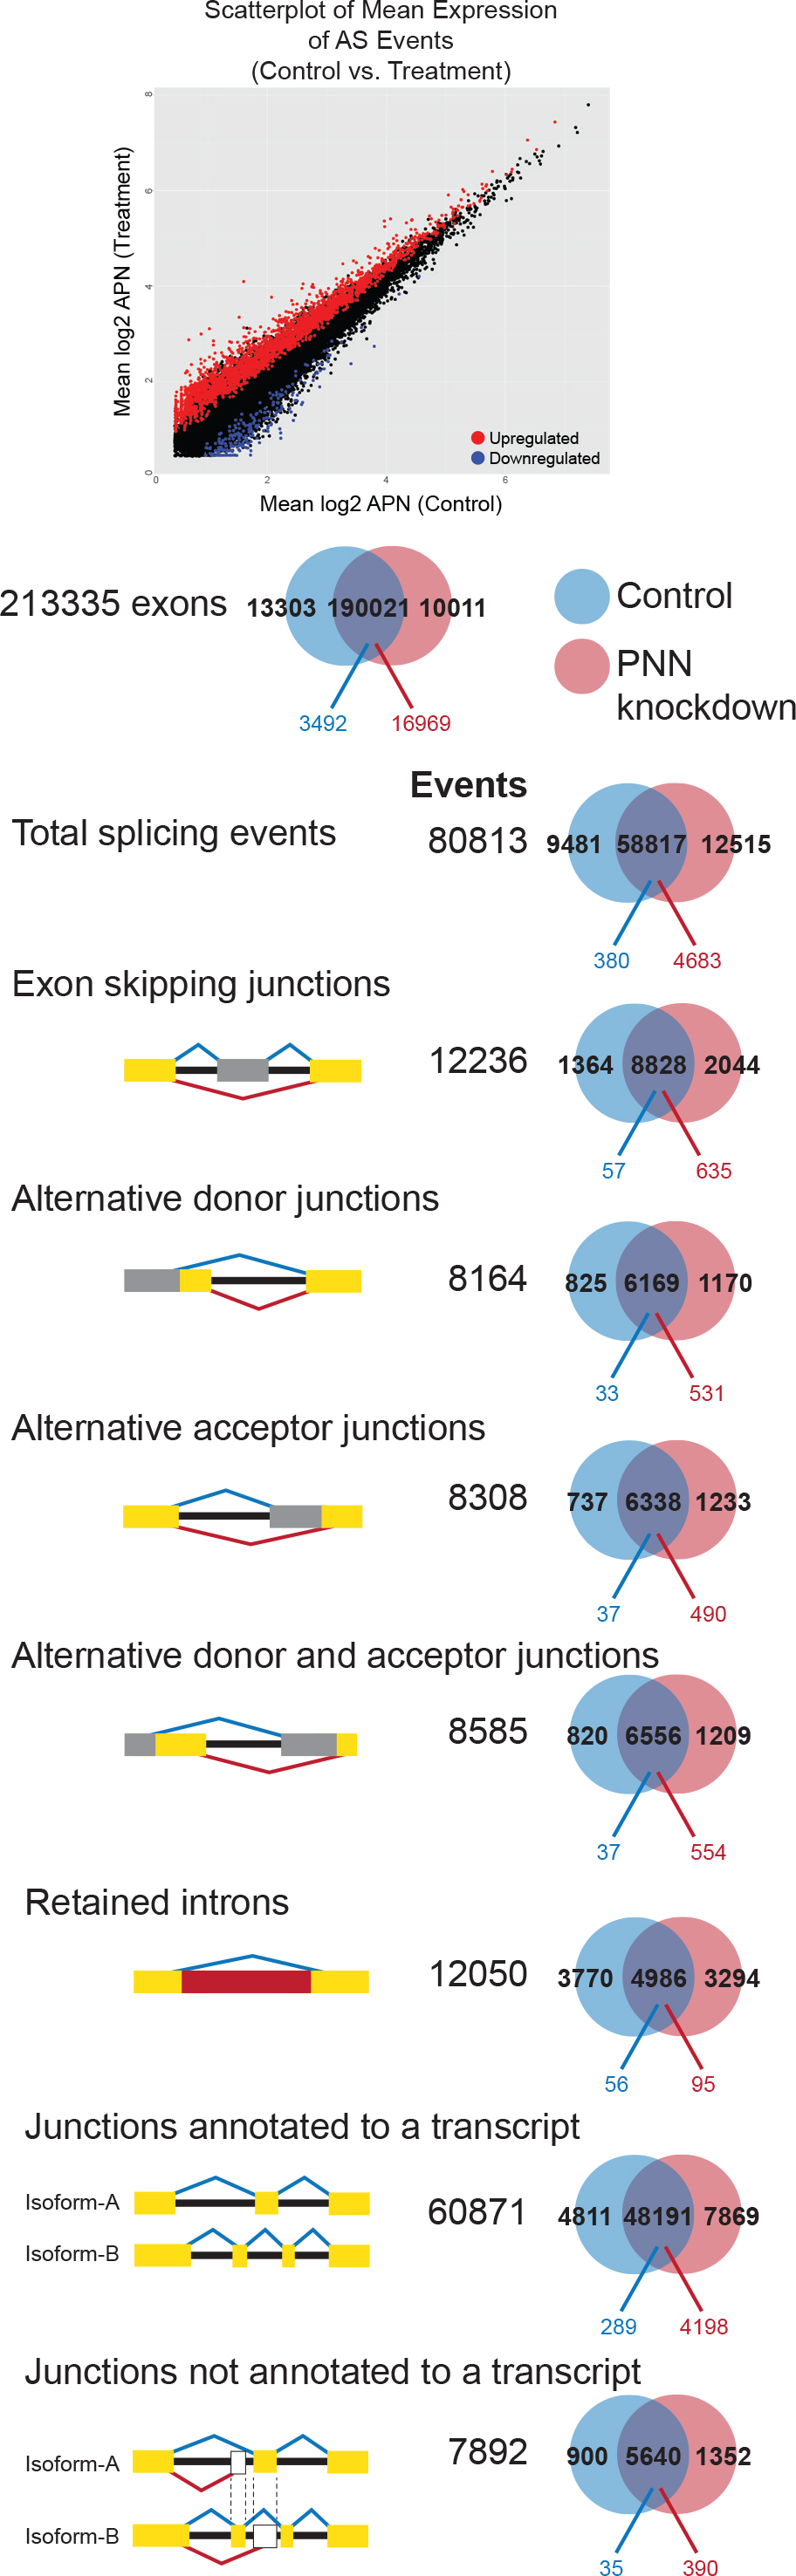
 Figure 3 of
Akin, Mol Vis 2016; 22:40-60.
Figure 3 of
Akin, Mol Vis 2016; 22:40-60.