Figure 9. Quantitative expression of cell markers in isolated RGCs. A: Quantitative real-time PCR for glial fibrillary acidic protein (GFAP), syntaxin 1, and Thy-1 of retinal ganglion cells (RGCs)
isolated with the two-step immunopanning (TIP), two-step immunopanning-magnetic (TIPM), and flow cytometry (FC) methods. The
Thy-1 levels in FC were the highest (p<0.05), and the syntaxin 1 levels were the lowest (p<0.05), while GFAP were zero. This
indicates that the purity of the RGCs from FC is the highest, followed by TIPM, and the RGC purity of TIP is the lowest of
the three methods. B: Relative mRNA levels of Thy-1, TUJ-1, Brn3b, syntaxin 1(syn), and GFAP from RGCs isolated with the FC method (high purity
and low purity). There were no significant differences in the mRNA expression levels, except for GFAP. Data expressed as relative
expression to the housekeeping gene β-actin. All relative RNA ratios expressed as the mean ± standard error of the mean (SEM;
n = 9).
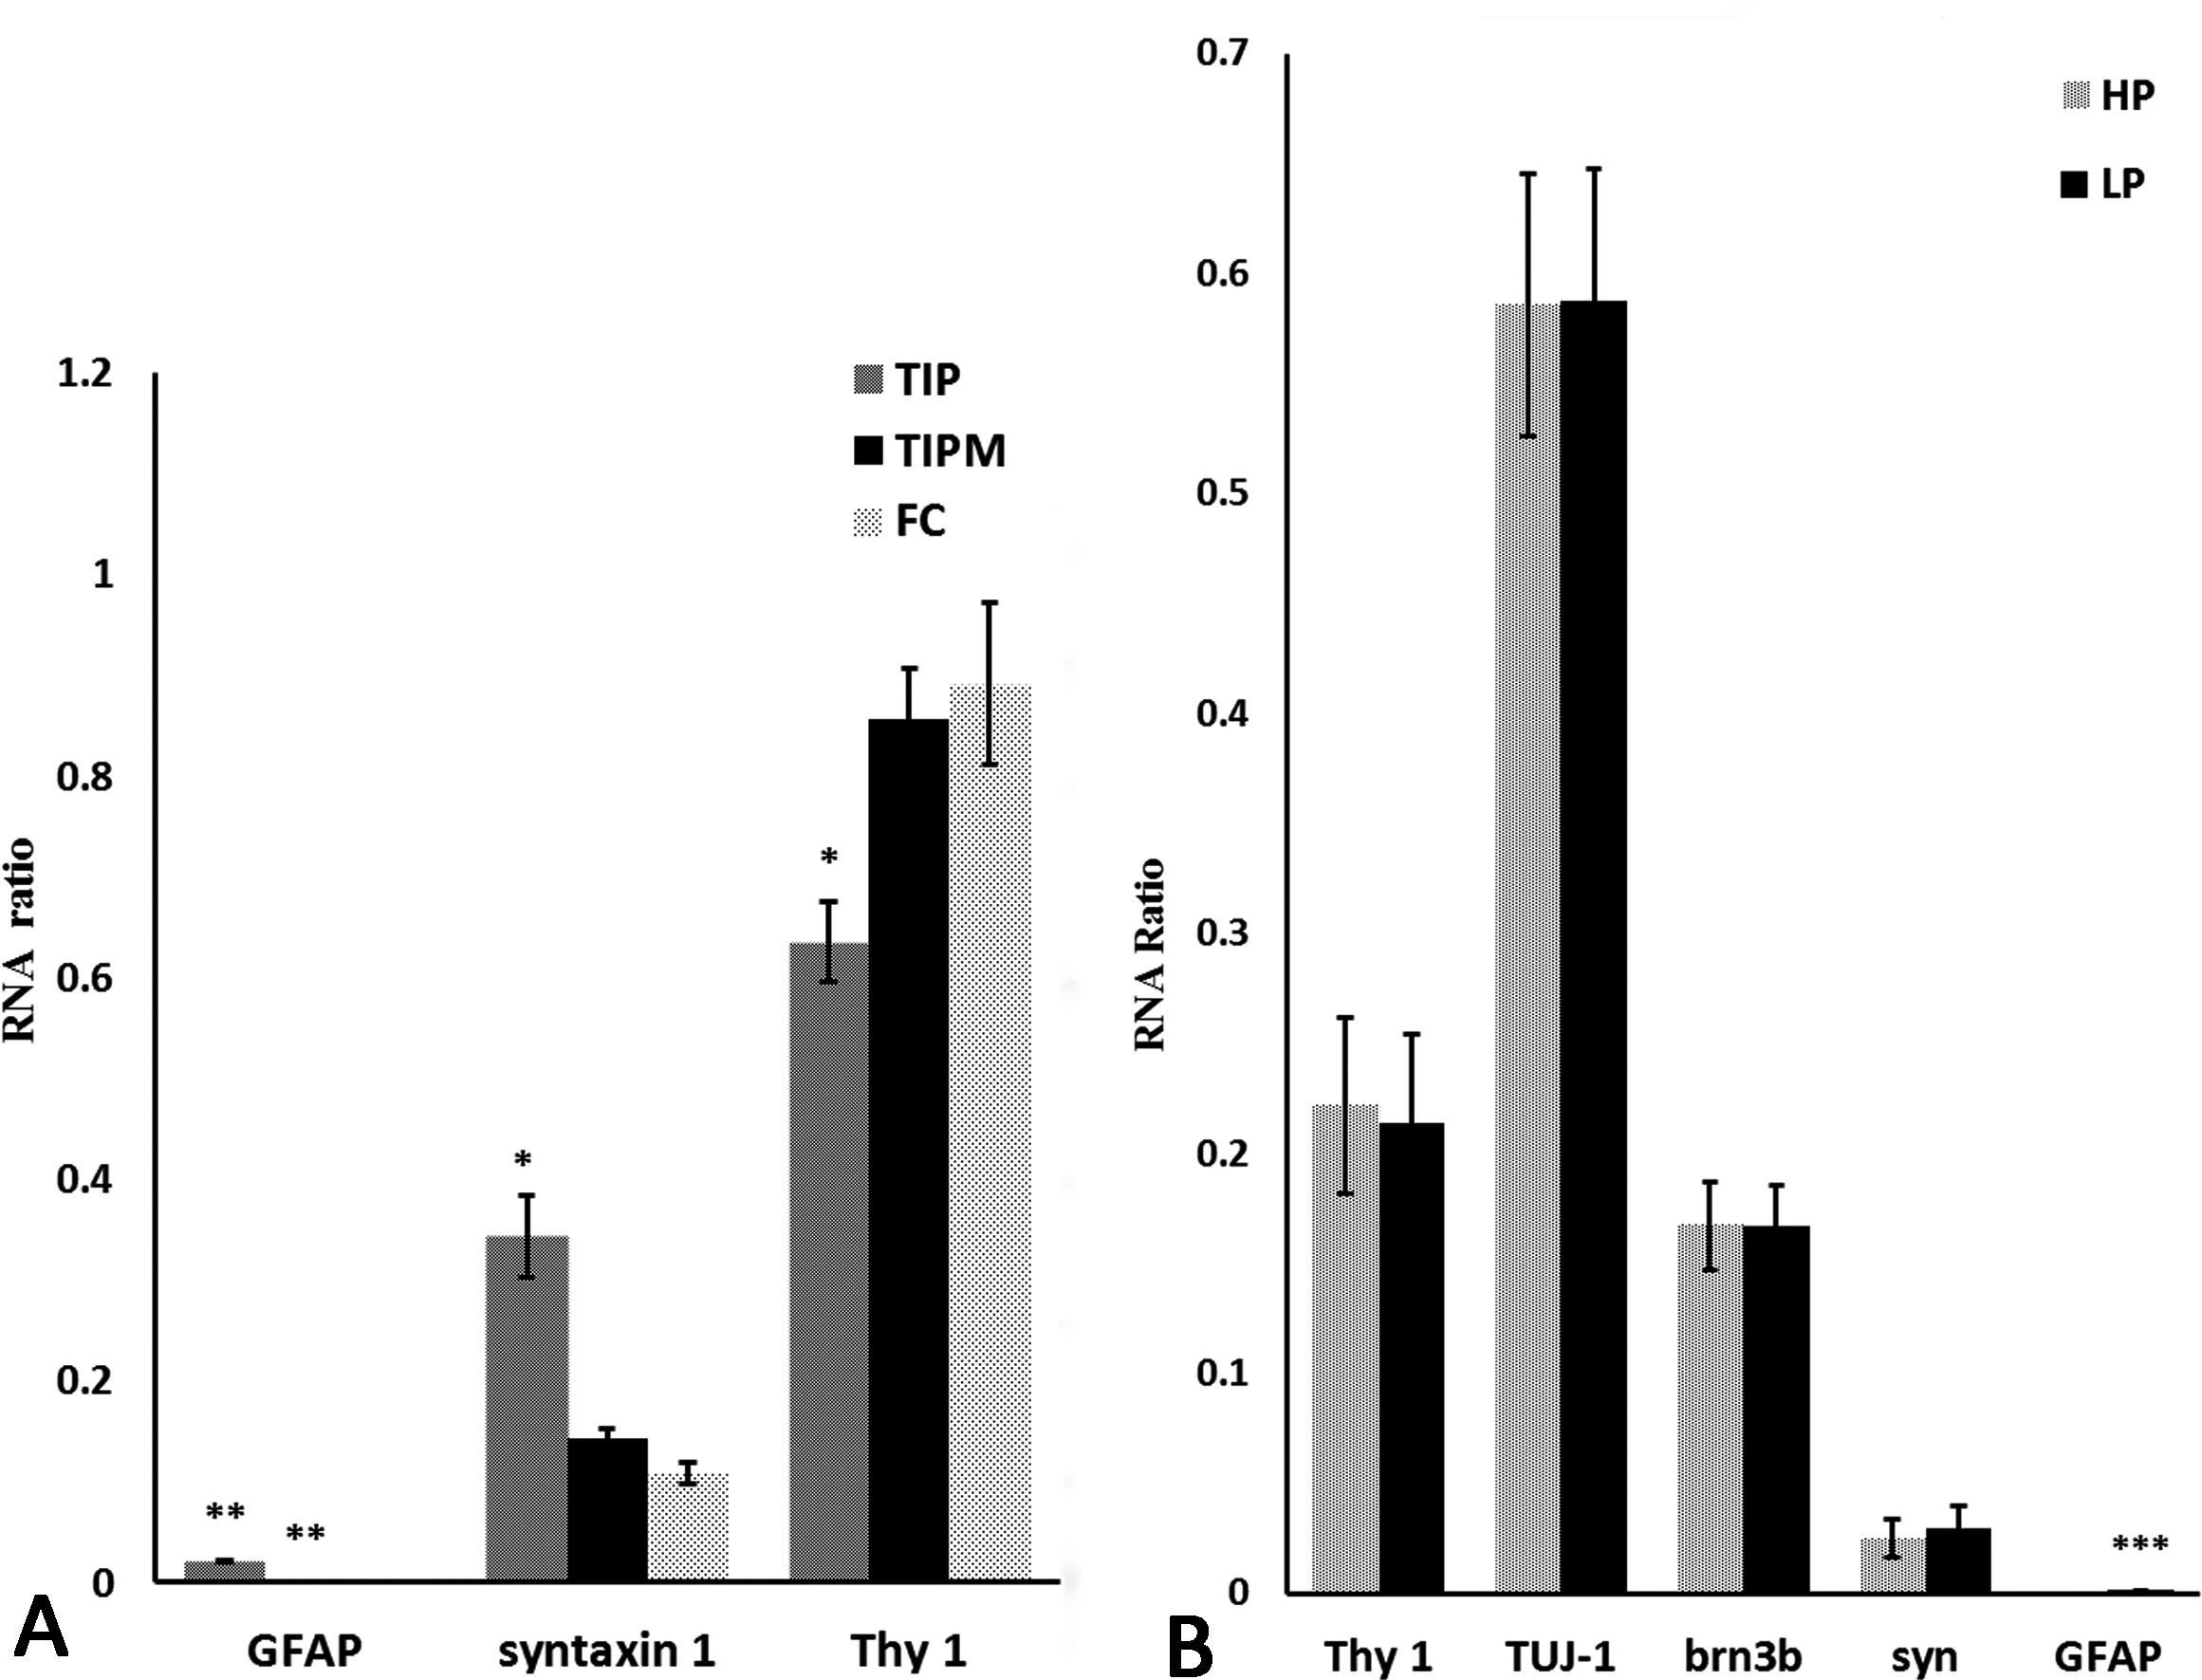
 Figure 9 of
Gao, Mol Vis 2016; 22:387-400.
Figure 9 of
Gao, Mol Vis 2016; 22:387-400.