Figure 10. Flow cytometry analysis of the purity of RGCs sorted with the TIP and TIPM methods. The retinal ganglion cells (RGCs) were
identified by staining with fluorescein isothiocyanate (FITC)–conjugated mAb against Thy-1 (Ex: 490 nm; Em: 520 nm).
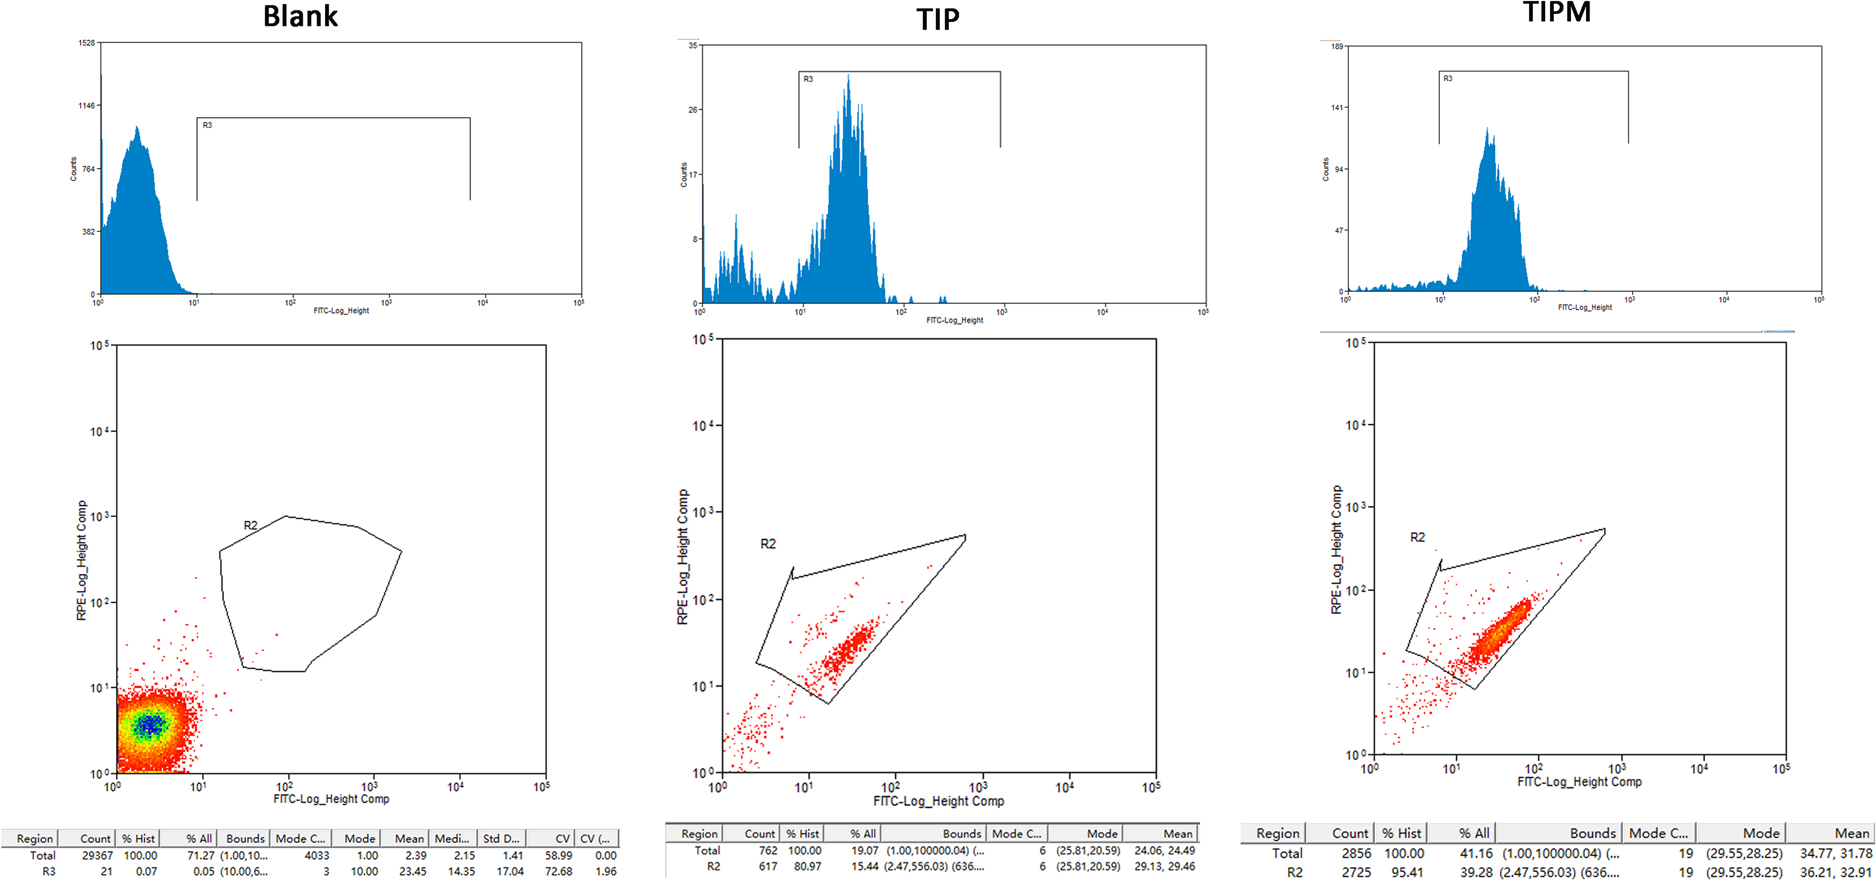
 Figure 10 of
Gao, Mol Vis 2016; 22:387-400.
Figure 10 of
Gao, Mol Vis 2016; 22:387-400.