Figure 6. Number of RGCs correlates with visual acuity, and RGC death occurs in Th17- but not Th1-induced EAE. A: Representative photomicrograph of a retinal flatmount immunostained with anti-Brn3a. White boxes (labeled 1–12) indicate
representative fields taken from peripheral (1, 4, 7, 10), medial (2, 5, 8, 11), and central (3, 6, 9, 12) regions of each
quadrant. Automated retinal ganglion cell (RGC) counts in the enhanced fields (shown in surrounding pictures) were performed
in Image J. B: Linear regression of the average optokinetic reflex (OKT) on the total number of RGCs counted in the 12 representative retinal
fields throughout the study for each Th1 (red circles, p = 0.0396) and Th17 (blue squares, p = 0.0023) experimental autoimmune
encephalomyelitis (EAE) eye at 13 and 21 days post-immunization (DPI) indicating significant positive correlations. n = 20
eyes from ten mice per group. C: Average total RGCs counted in each retinal region of all eyes at 13 and 21 dpi for Th1 (red middle bars), Th17 (blue right
bars), and healthy, age- and strain-matched control mice (purple left bars). n = 20 eyes from ten mice per group. D: Average total regional RGCs counted in the more affected eyes of each EAE mouse at 21 dpi for Th1 (red middle bars), Th17
(blue right bars), and healthy, age-, and strain-matched control mice (purple left bars). n = 5. Error bars represent standard
error of the mean (SEM). *p<0.05 by the linear mixed effect model.
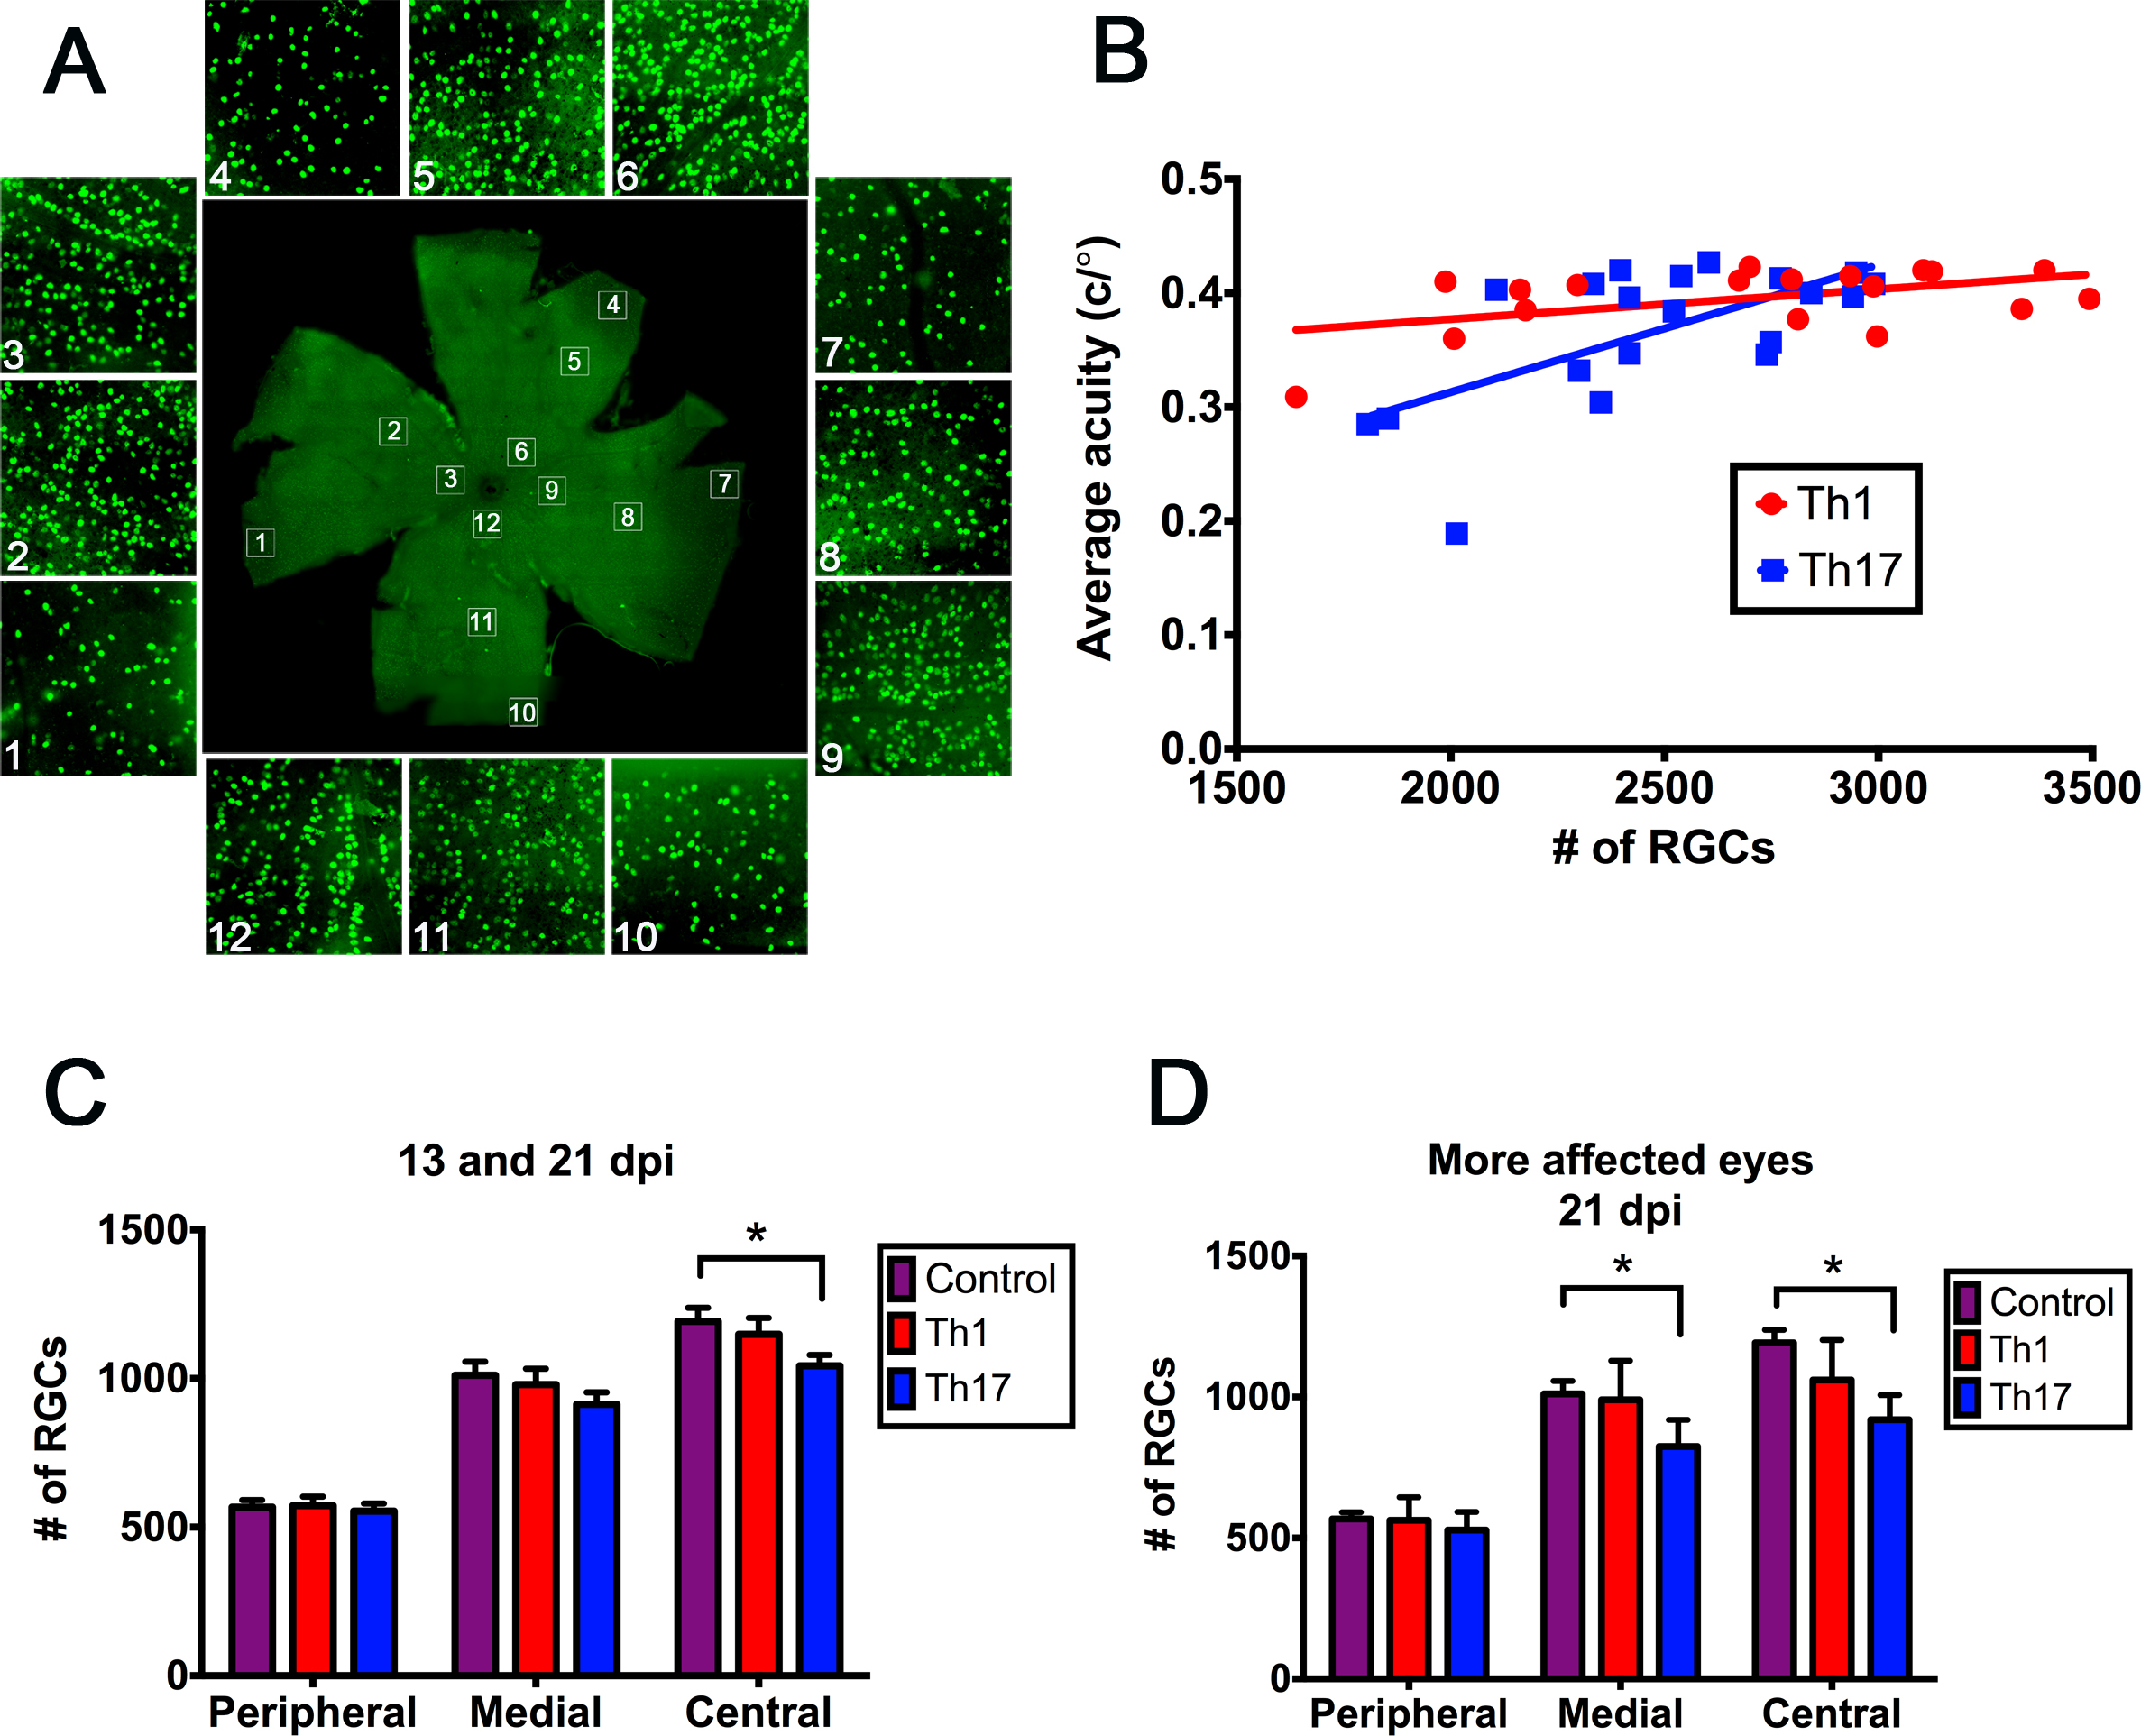
 Figure 6 of
Larabee, Mol Vis 2016; 22:332-341.
Figure 6 of
Larabee, Mol Vis 2016; 22:332-341.