Figure 5. Th17-induced optic neuritis consists of a higher neutrophil to macrophage ratio relative to Th1. Quantitation of cell type-specific
markers in paraffin-embedded optic nerves from mice harvested at 13 and 21 days post-immunization (DPI). Each nerve is represented
as the average value from two separate longitudinal sections. A: Myelination as measured by the percentage of nerves positive for the anti-CNPase signal, p = 0.0770. B: T-cells as measured by the number of CD3-positive cells counted in three representative 20X fields throughout each section,
p = 0.2788. C: B-cells as measured by the number of B220-positive cells counted in three representative 20X fields throughout each section,
p = 0.3527. D: Macrophage and microglia infiltration as measured by the percentage of nerves positive for the anti-Iba1 signal, p = 0.8583.
E: Neutrophil infiltration scored on a scale of 0–3 for the anti-Ly6G signal where 0 = no signal, 1 = 1–15 cells, 2 = 16–30
cells, and 3 = more than 30 cells, p = 0.0540. F: The ratio of the Ly6G:Iba1 values for each optic nerve, p = 0.0050. All comparisons made with a linear mixed effect model.
Testing for B220, CD3, and CNPase effects was performed on a log scale. Error bars represent standard deviation (SD). n =
20 eyes from ten mice per group.
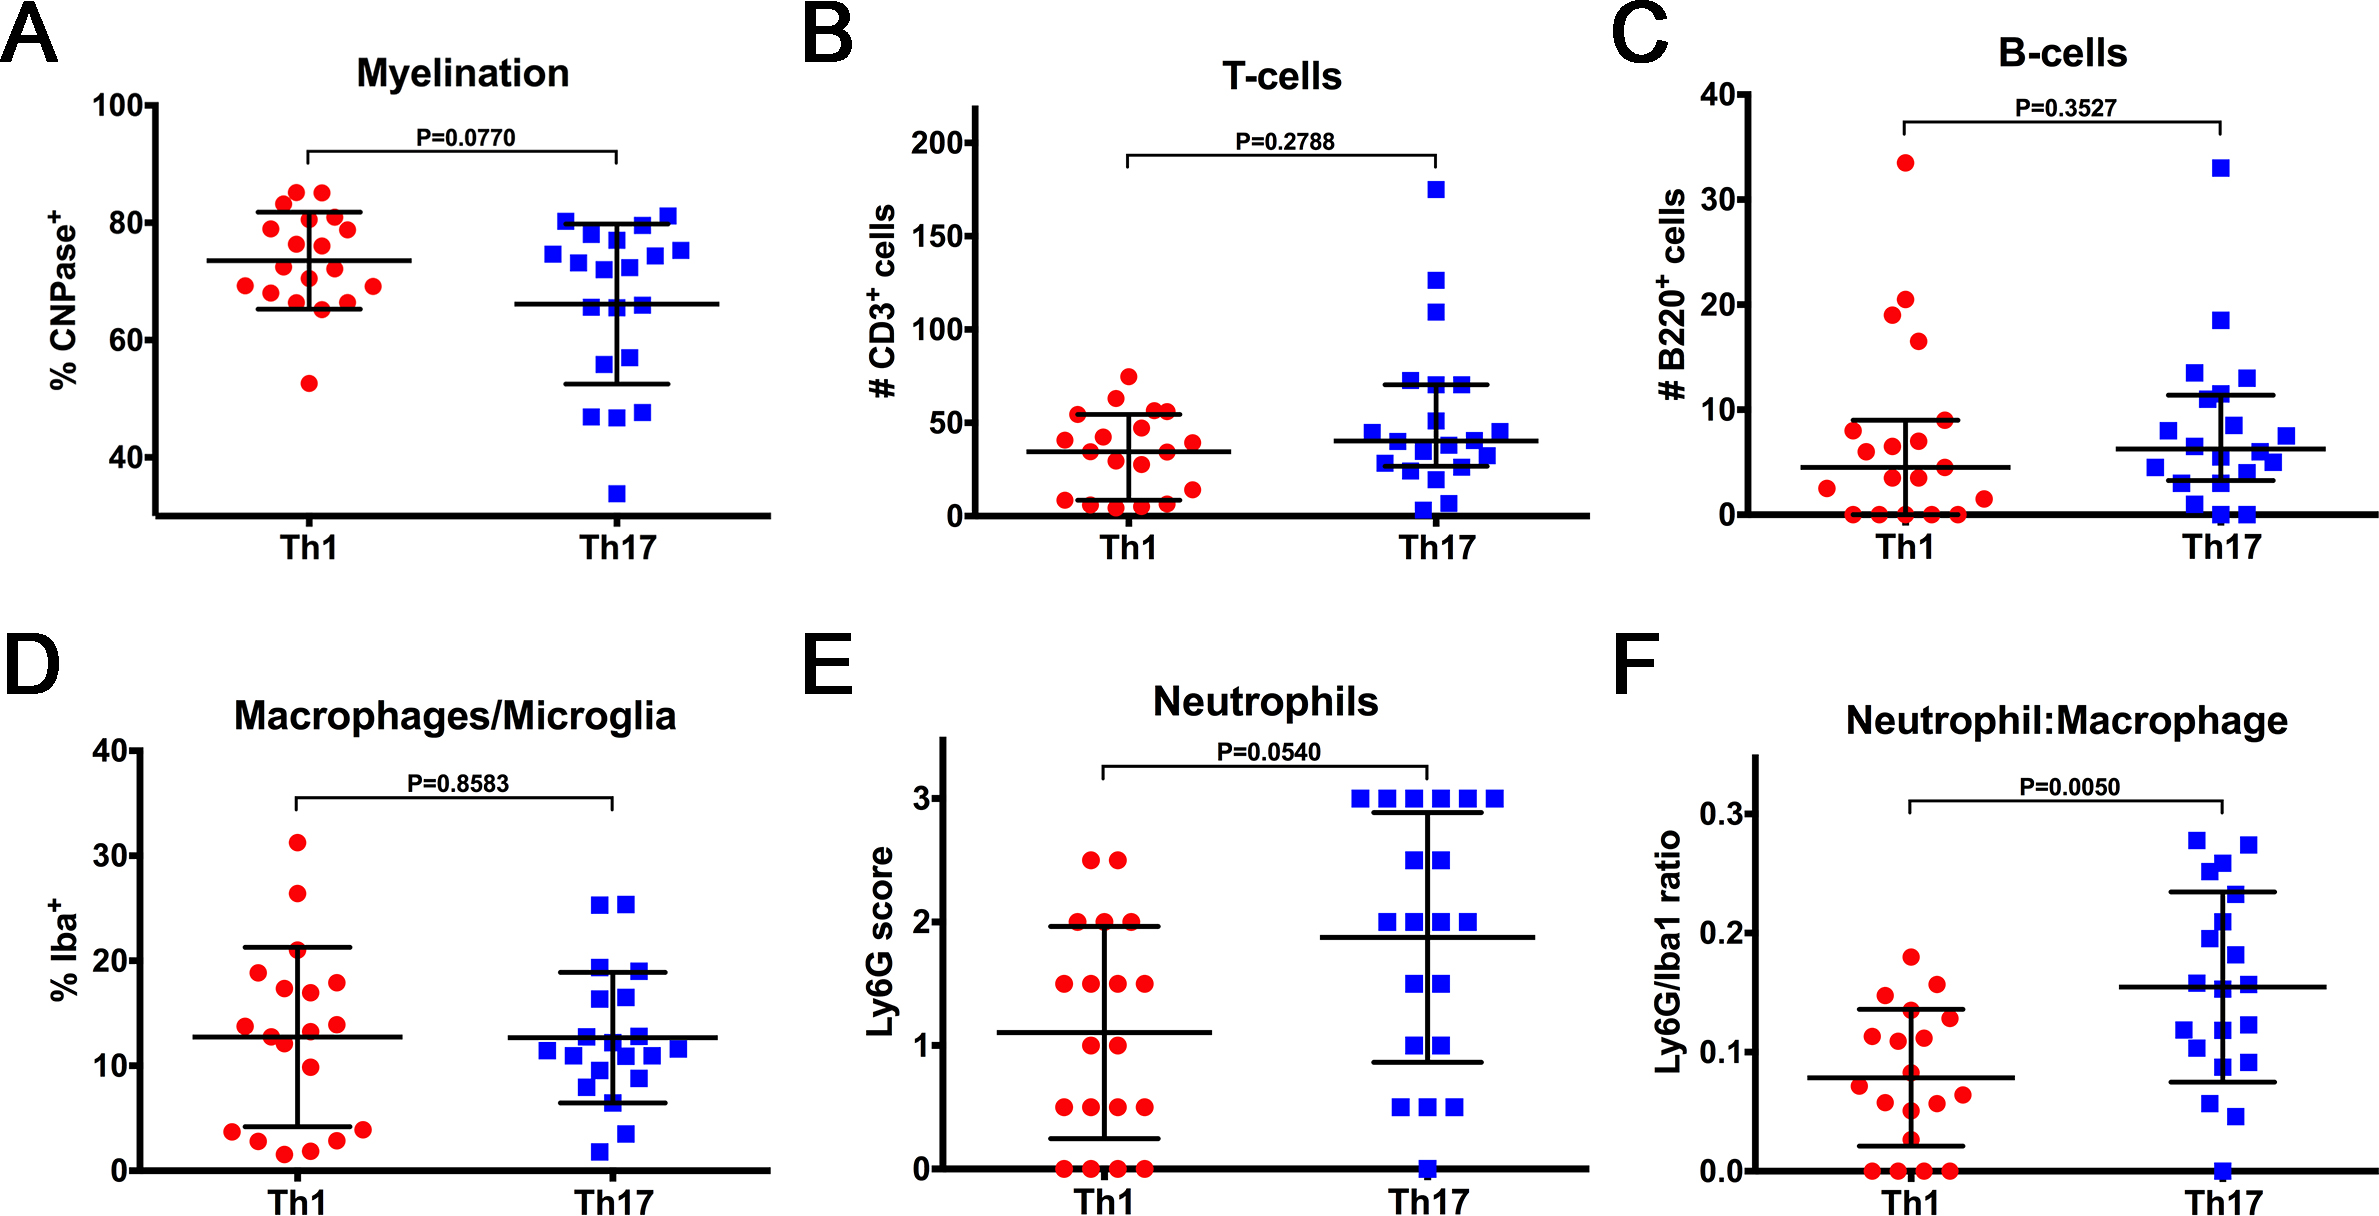
 Figure 5 of
Larabee, Mol Vis 2016; 22:332-341.
Figure 5 of
Larabee, Mol Vis 2016; 22:332-341.