Figure 4. Variation in intercellular boundaries viewed at different apicobasal levels. A: ZO-1 antibody delineates the borders of individual cells near the apical corneal endothelial cell (CEC) surface (0.3 µm
from the apical pole). B–D: Imaging of anti-neural cell adhesion molecule (NCAM)-labeled membranes at (B) 0.3 µm, (C) 1.2 µm, and (D) 2.1 µm from the apical pole. In (B), the cell boundaries outlined by the NCAM antibody deviate somewhat from those visualized with anti-ZO-1 labeling. A progressive
expansion of the CEC lateral membranes is seen as the plane of the optical section passes nearer to the endothelium basal
pole (C, D). E: Boxed area in panel (A) overlaid with the corresponding region from panel (D), shown at higher magnification. Note that the subapical NCAM-containing membranes form expansions that extend centrally
and peripherally to the apical (anti-ZO-1-labeled) borders. Using the overlay in (E), outlines of a single cell have been drawn at its apical and basal poles (F). All images represent single confocal optical sections.
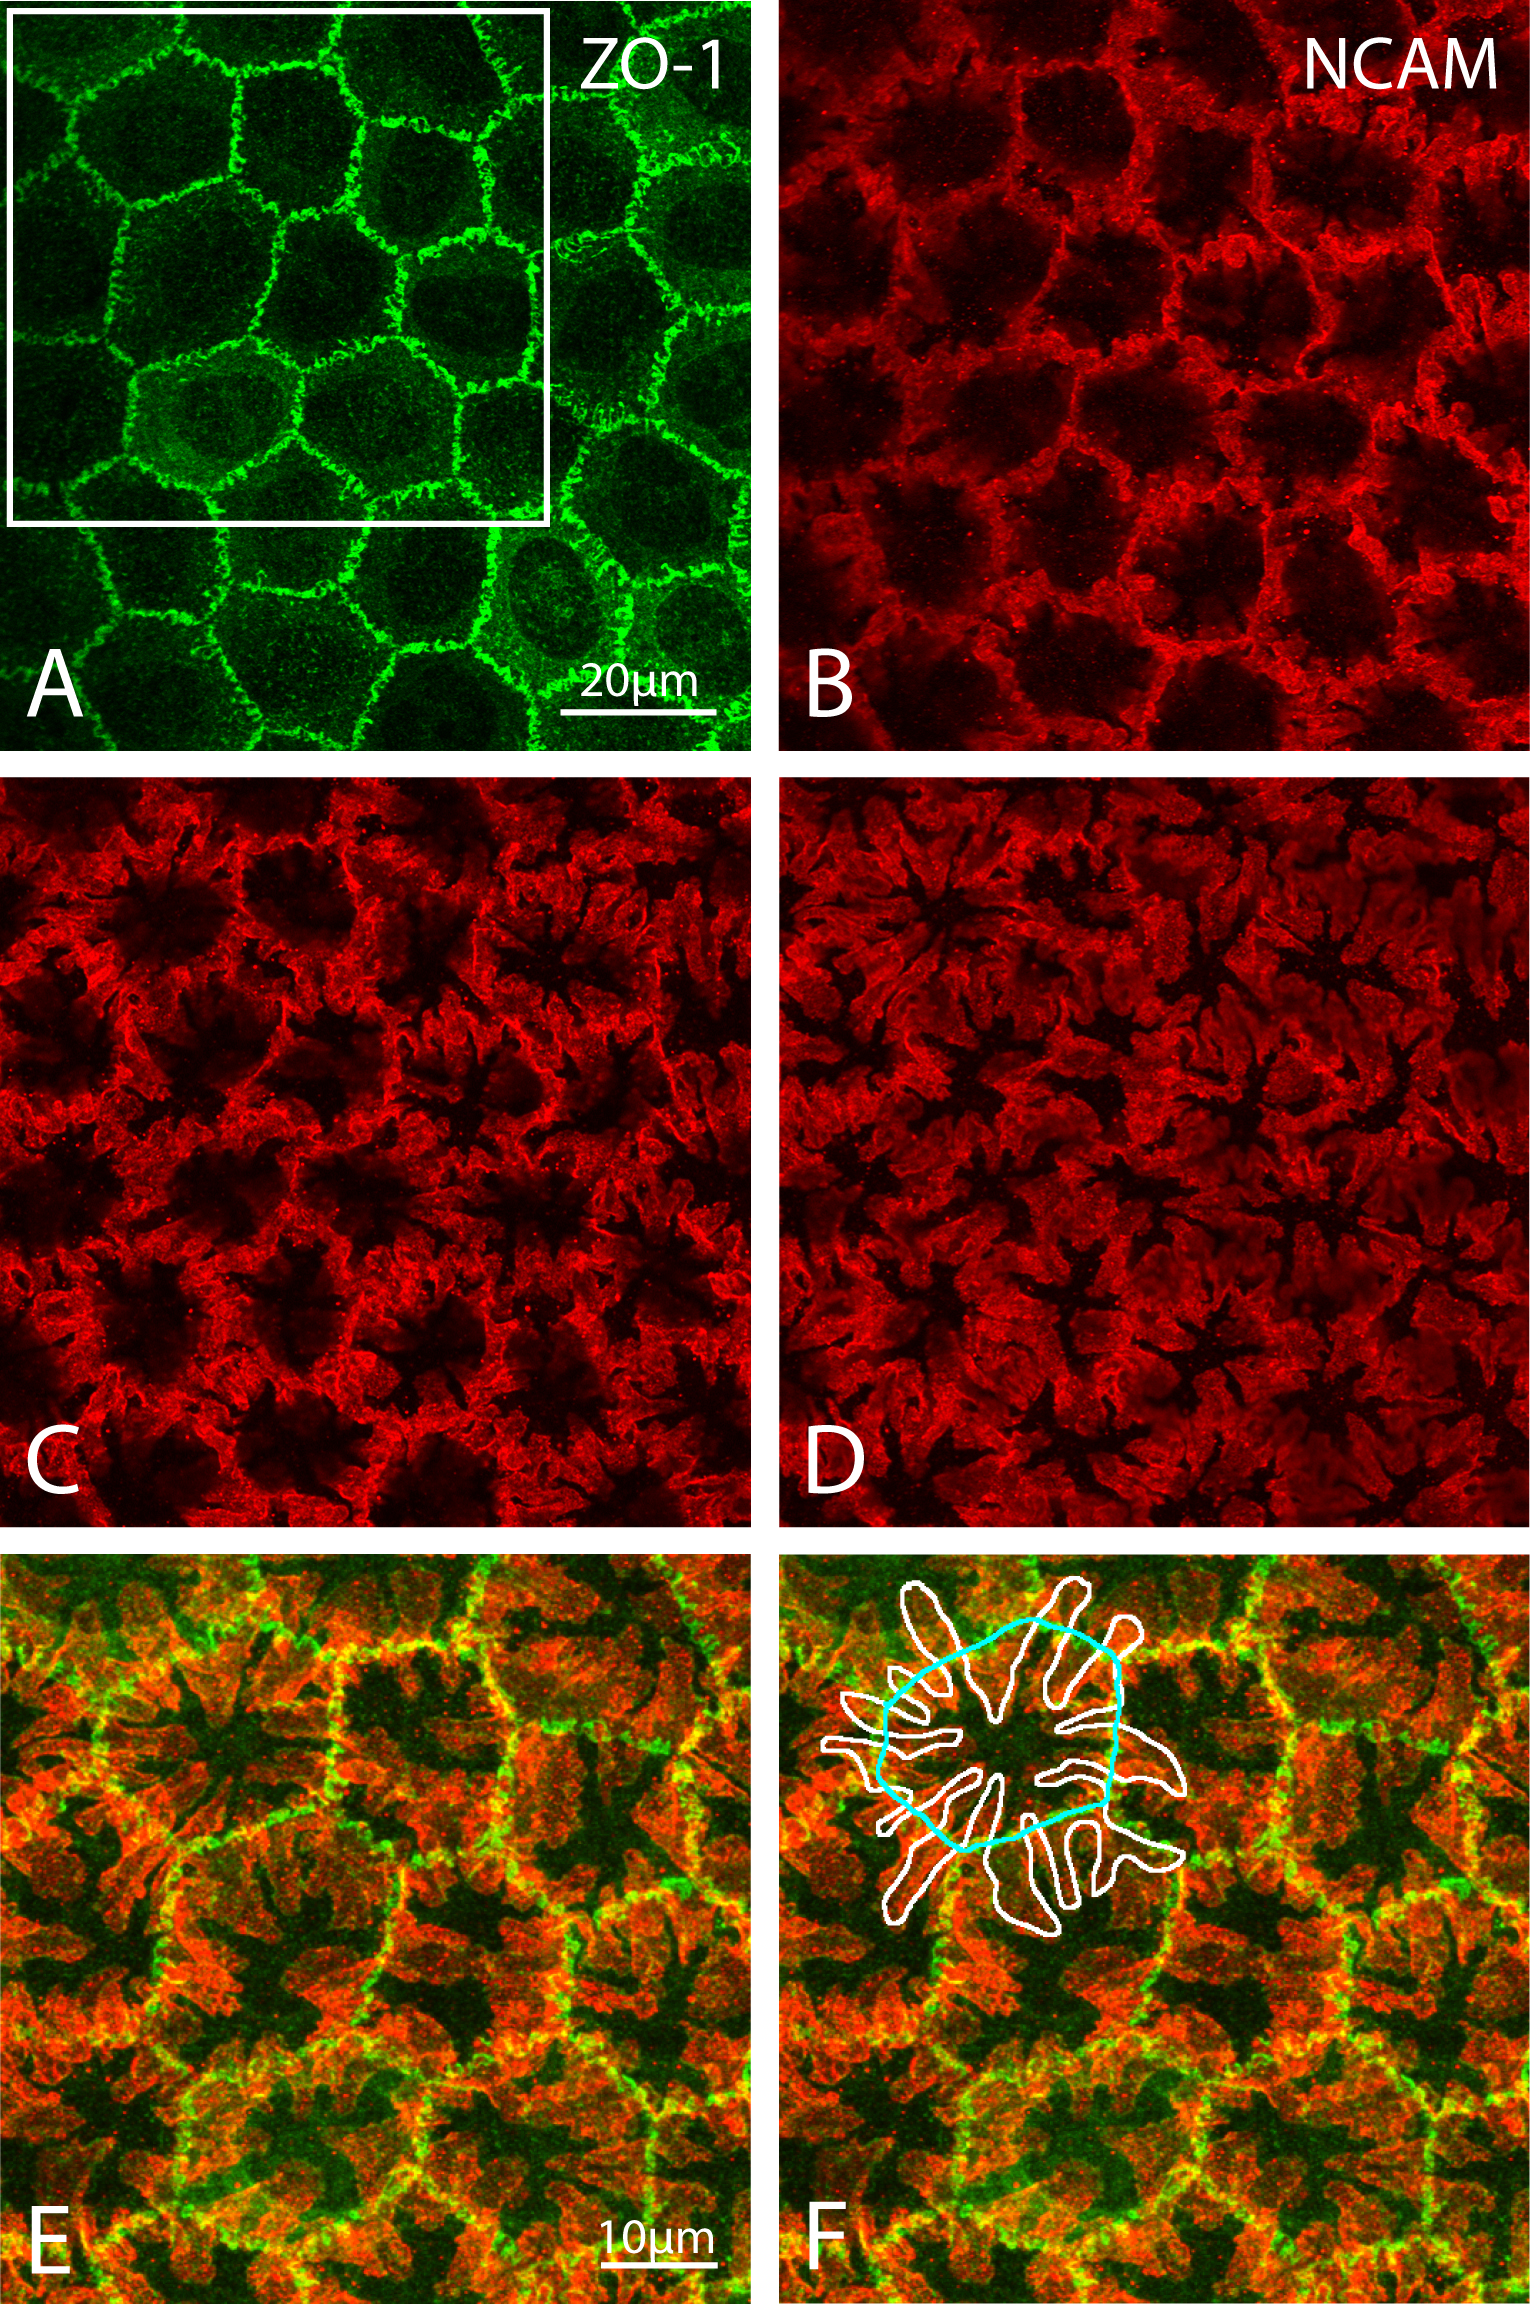
 Figure 4 of
Harrison, Mol Vis 2016; 22:31-39.
Figure 4 of
Harrison, Mol Vis 2016; 22:31-39.