Figure 1. Reporter gene expression in mouse corneal endothelial cells. A–C: P0-Cre-driven expression of tdTomato. A: In this low-power confocal projection image, the labeled cells exhibit irregular projections that extend in the plane of
the monolayer. Asterisks mark areas of non-expressing cells, one of which (indicated by the box) is viewed at higher power
in (B) and (C). B: Optical section at 0.3 µm from the apical pole reveals the linear borders of cells where they are connected by junctions
(arrows). C: At 2.1 µm relative to the apical pole, fluorescent protein expression fills the pseudopod-like processes (arrowheads) that
extend into the territory of a non-expressing cell. D-H: HPRT-Cre-mediated mosaic analysis with double markers (MADM) labeling. D: Cells marked due to interchromosomal recombination events (see Methods) are scattered among mainly unlabeled endothelial
cells in this cornea flatmount viewed at low magnification. This overlay image shows green fluorescent protein (GFP)-expressing
(green) cells, c-Myc-red fluorescent protein (RFP)-expressing (red), and cells expressing both fluorescent proteins (yellow).
E–G: A field of view similar to that in D is seen at higher power. Where a green cell and a yellow cell occur closely adjacent to one another, their processes can
be seen to overlap and interdigitate (arrow in E). Images collected in the RFP and GFP channels (F and G, respectively) compose the overlay image in (E). H: In this high-magnification image of nearby but non-adjacent MADM-labeled cells, the distinctive star-shaped morphology of
corneal endothelial cells, with their branched dendritic processes, can be clearly appreciated. Images D–H represent projections of all optical sections in the data set.
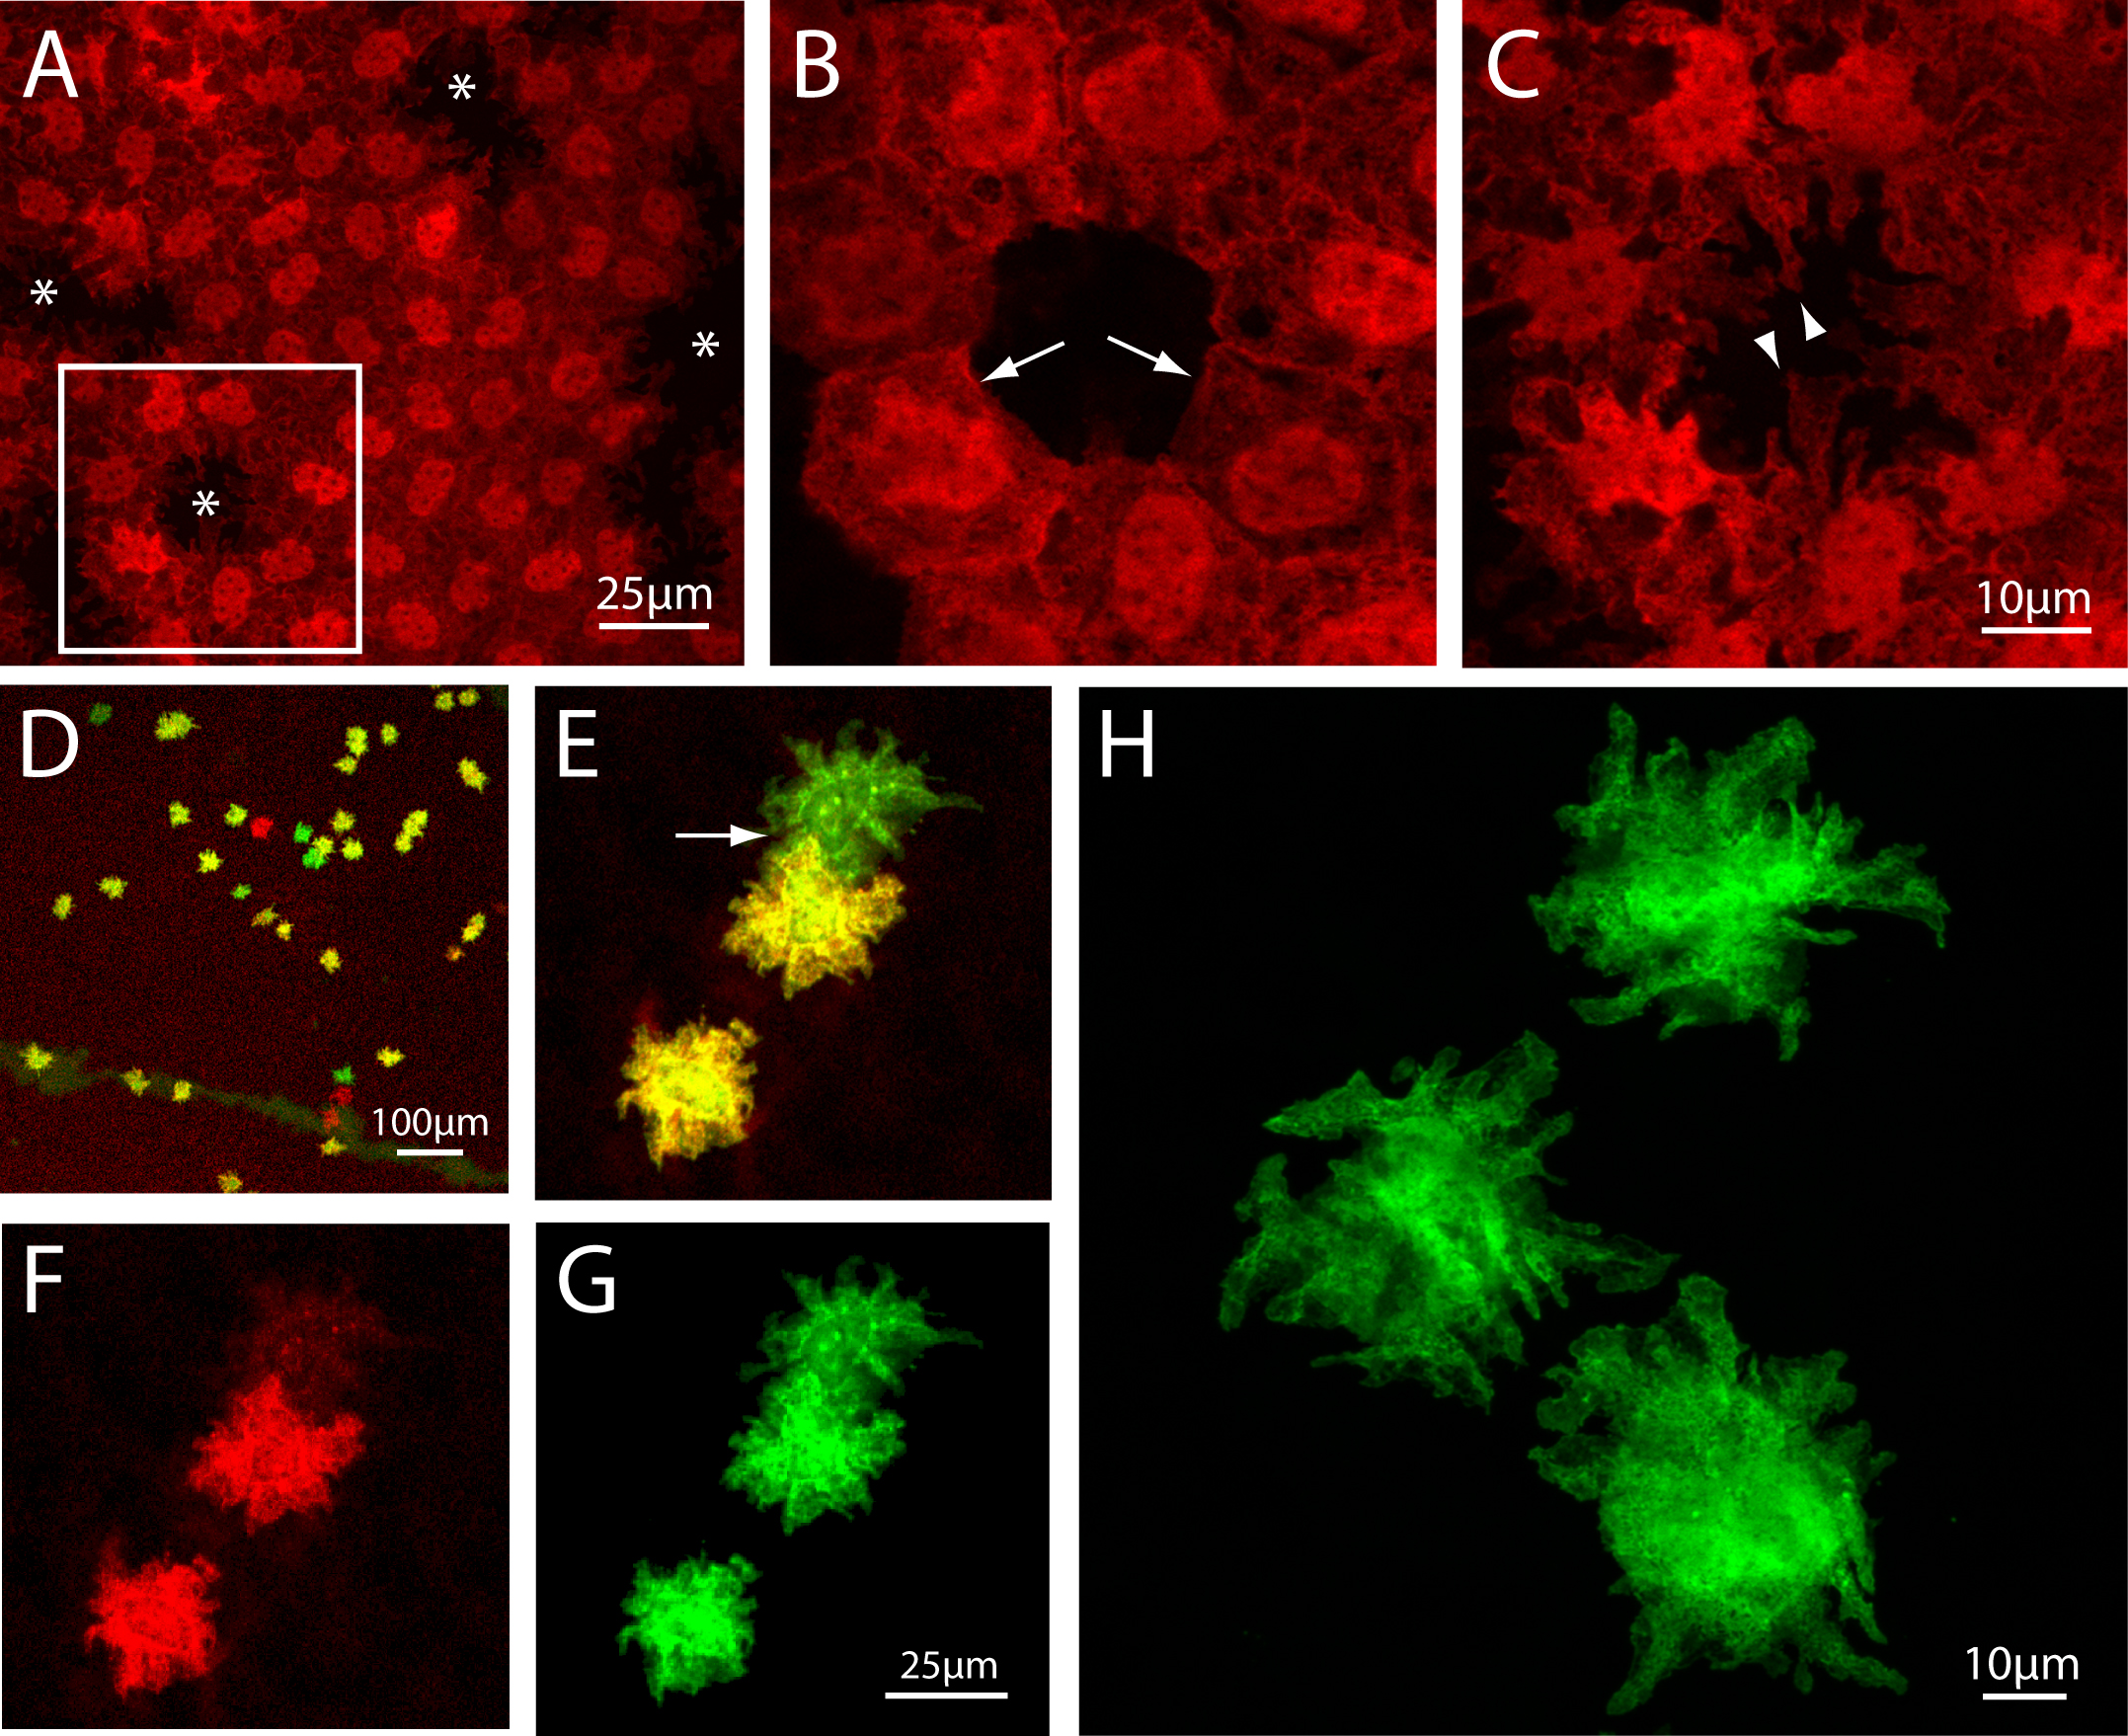
 Figure 1 of
Harrison, Mol Vis 2016; 22:31-39.
Figure 1 of
Harrison, Mol Vis 2016; 22:31-39.