Figure 5. TID and IOP interval maps are unique and contain non-overlapping peaks. A: Intraocular pressure (IOP) does not show statistically suggestive or statistically significant peaks at the locations of
Tyrp1 (left vertical box) or Gpnmb (right vertical box), suggesting that these genes do not modulate IOP in BXD mice. B: In contrast, the transillumination defect (TID) mapped with a high likelihood ratio statistic (LRS) score to Tyrp1 in the 6- to 9-month-old cohort of the BXD strains.
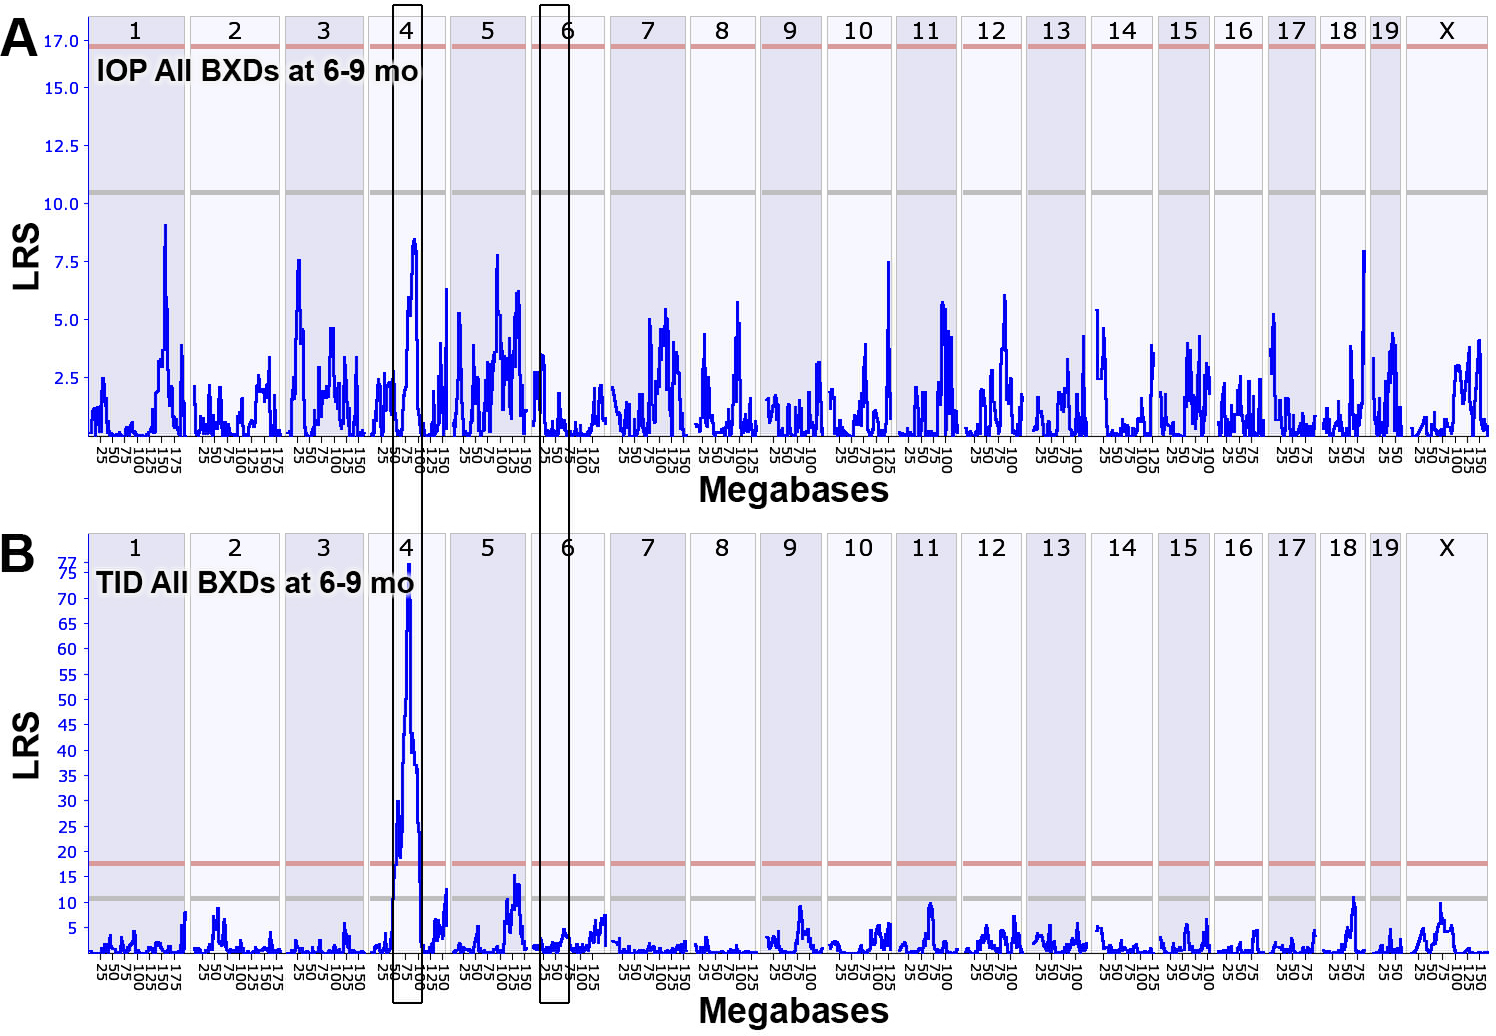
 Figure 5 of
Lu, Mol Vis 2016; 22:224-233.
Figure 5 of
Lu, Mol Vis 2016; 22:224-233.