Figure 6. Effect of emission filter bandwidth on fluorescence intensities of Alexa-568, autofluorescence (AF), and Hoechst 33342 after
two-photon (2P) excitation. Fluorescence from Alexa-568-phalloidin (red), Hoechst 33342 (green; 500–550 nm) and AF was collected
from the uveal meshwork through near-red (565–605 nm; A, C, E, G, I, K) and far-red (590–680 nm; B, D, F, H, J, L) emission filters following 2P excitation at 800 nm (800 nm ex), 850 nm (850 nm ex), or 900 nm (900 nm ex). Boxes: region-of-interest
(ROI) analysis of fluorescence intensity (red, green, or red/green ratio (yellow values)). Tissues were without (A, B, E, F, I, J) or with Alexa-568-phalloidin (C, D, G, H, K, L) label. Arrows: Hoechst 33342–labeled nuclei. Bar=25 μm.
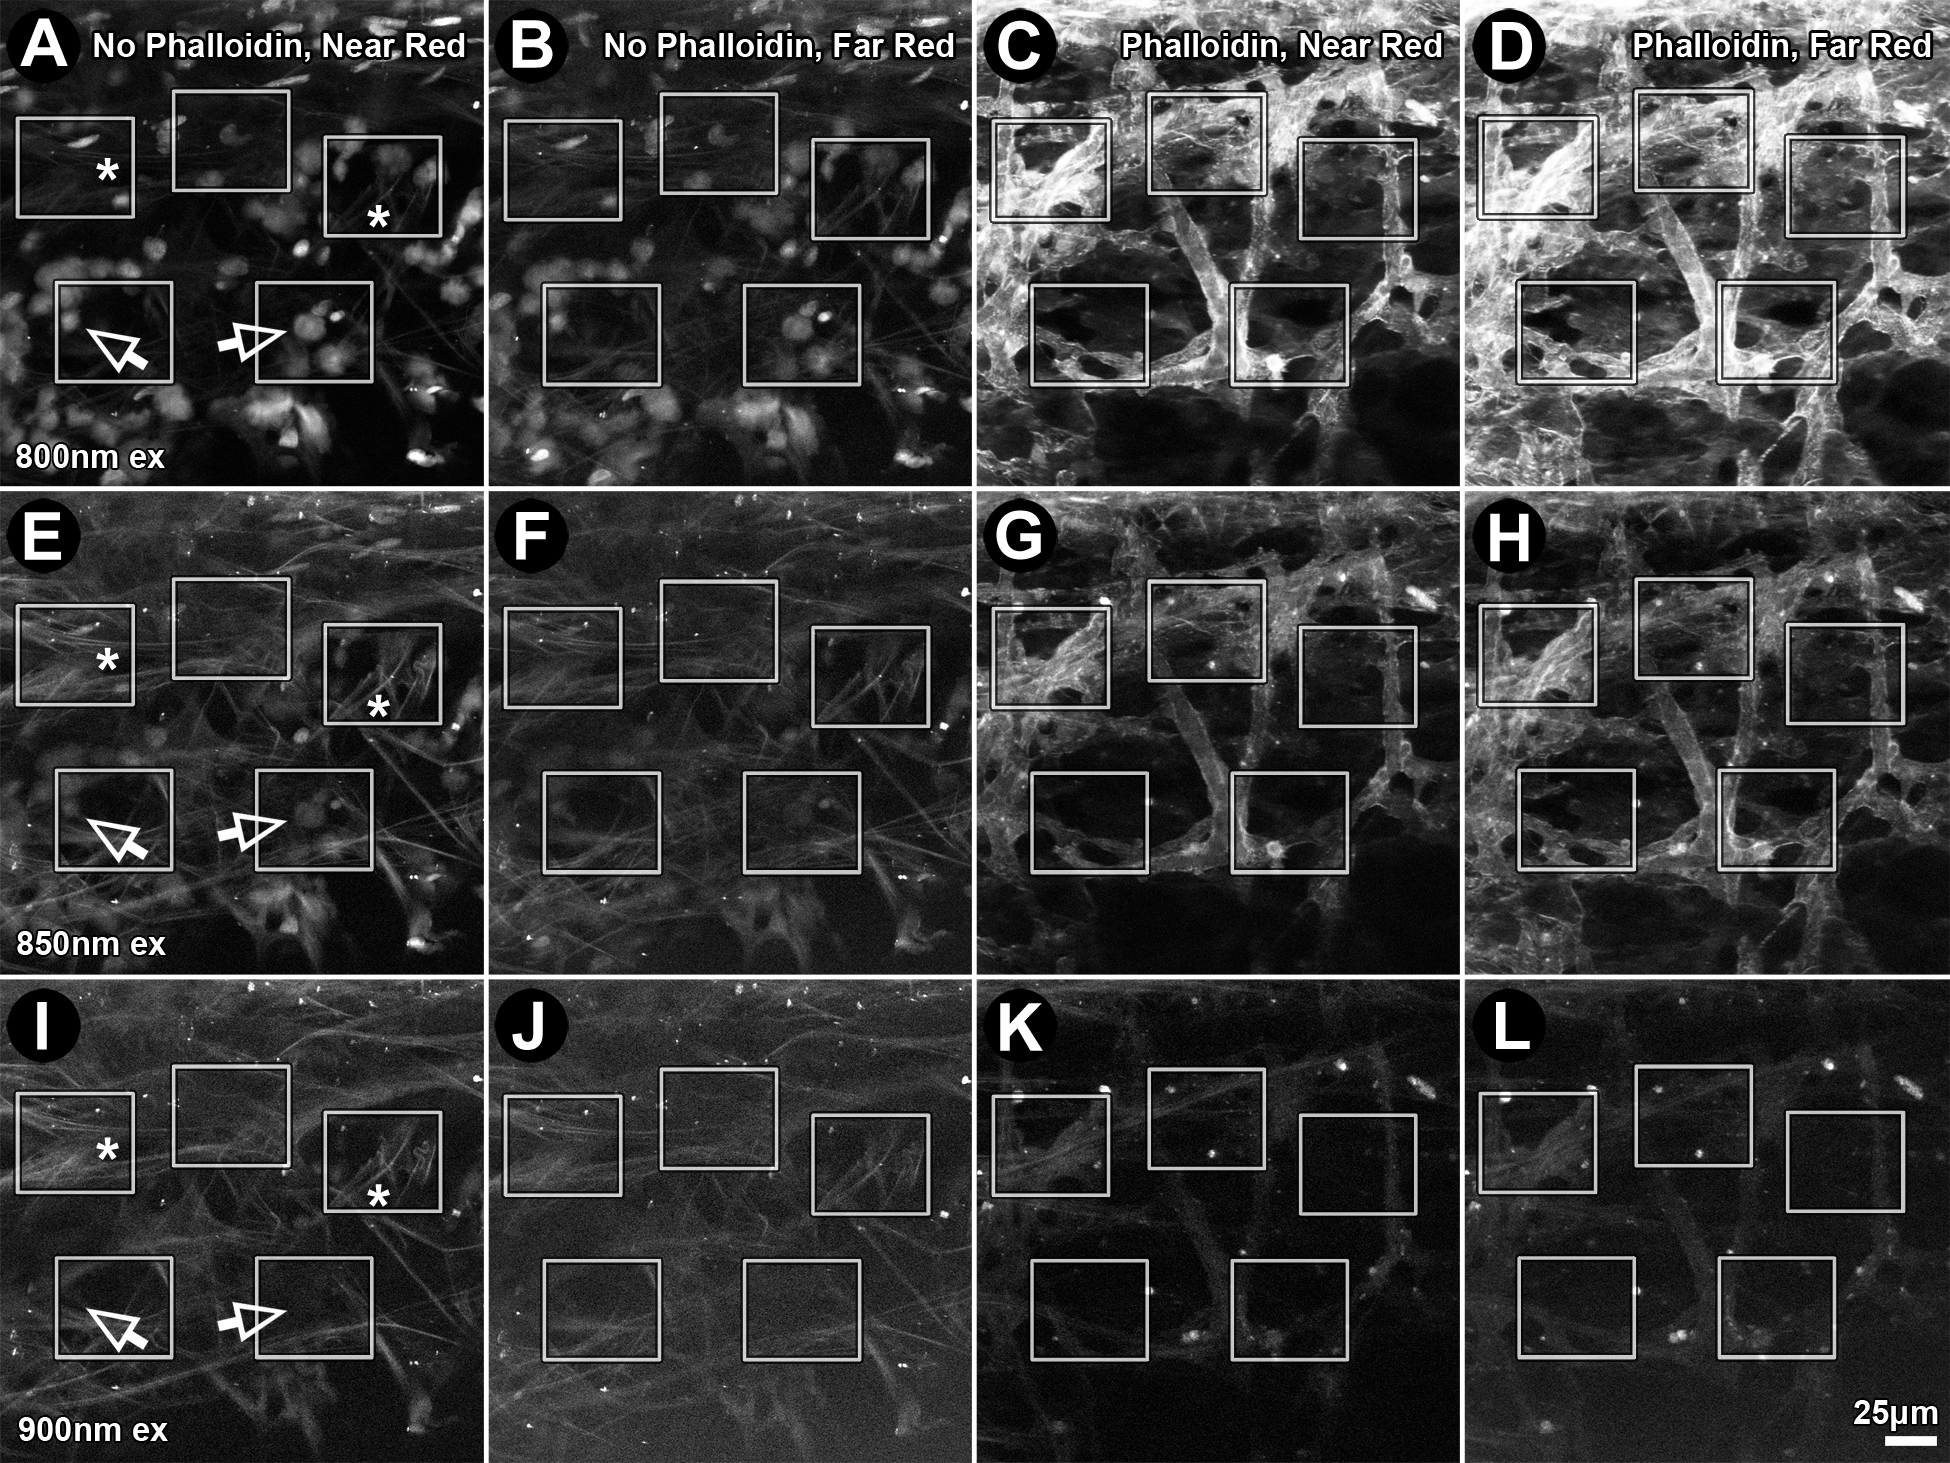
 Figure 6 of
Gonzalez, Mol Vis 2016; 22:203-212.
Figure 6 of
Gonzalez, Mol Vis 2016; 22:203-212.