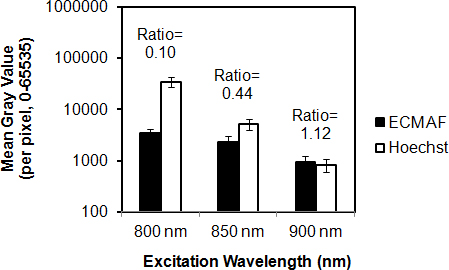
Figure 4. Effect of excitation wavelength on relative Hoechst 33342 fluorescence and autofluorescence intensities. Autofluorescence
(AF) from the extracellular matrix (black columns) and Hoechst 33342 nuclear fluorescence (white columns) were collected in
the green channel (500–550 nm) with varying two-photon (2P) excitation wavelengths. Fluorescence intensities (mean gray value)
were measured within regions-of-interest illustrated in
Figure 3. AF-to-Hoechst 33342 ratios increased sharply with increasing excitation wavelength (800 nm to 900 nm). The y-axis (mean
gray value of fluorescence intensity) is set to a logarithmic (base 10) scale. Error bars=standard deviation.
 Figure 4 of
Gonzalez, Mol Vis 2016; 22:203-212.
Figure 4 of
Gonzalez, Mol Vis 2016; 22:203-212.