Figure 3. Nrf2-deficient mice exhibit more severe EAE-associated monocular visual acuity deficits. A: Representative time course of acute, monocular episodes of deficits in visual acuity as measured with optokinetic tracking
(OKT) of an experimental autoimmune encephalomyelitis (EAE) mouse. The more affected (MA) eye (purple circles) deficits coincide
with the onset of motor deficits (green triangles), whereas the less affected (LA) eye (gray squares) does not exhibit substantial
acuity loss. B: Area under the curve (AUC) of visual acuity values (cycles per degree) throughout the experiment for the MA and LA eyes
of wild-type (WT; blue circles) and knockout (KO; red squares) EAE mice in which two eyes from the same mouse are connected
by a line. n = 10–12 mice. Two-tailed paired t test was used for statistical analysis. C, D: Average daily visual acuity of the MA eyes as measured with OKT for WT male mice (C, aqua circles), WT female mice (C, orange squares), KO male mice (D, green triangles), and KO female mice (D, purple upside-down triangles). n = 4–6. E, F: Average daily visual acuity of the LA eyes as measured with OKT for WT male mice (E, aqua circles), WT female mice (E, orange squares), KO male mice (F, green triangles), and KO female mice (F, purple upside-down triangles). n = 4–6. G, H: Average daily visual acuity measurements of the MA eyes (G) and the LA eyes (H) as measured with OKT for the WT mice (blue circles) and the KO mice (red squares) with male and female mice combined. n
= 10–12. C–H: Error bars represent standard error of the mean (SEM). *p<0.05, **p<0.005, and ***p<0.001 by the linear mixed-effects model.
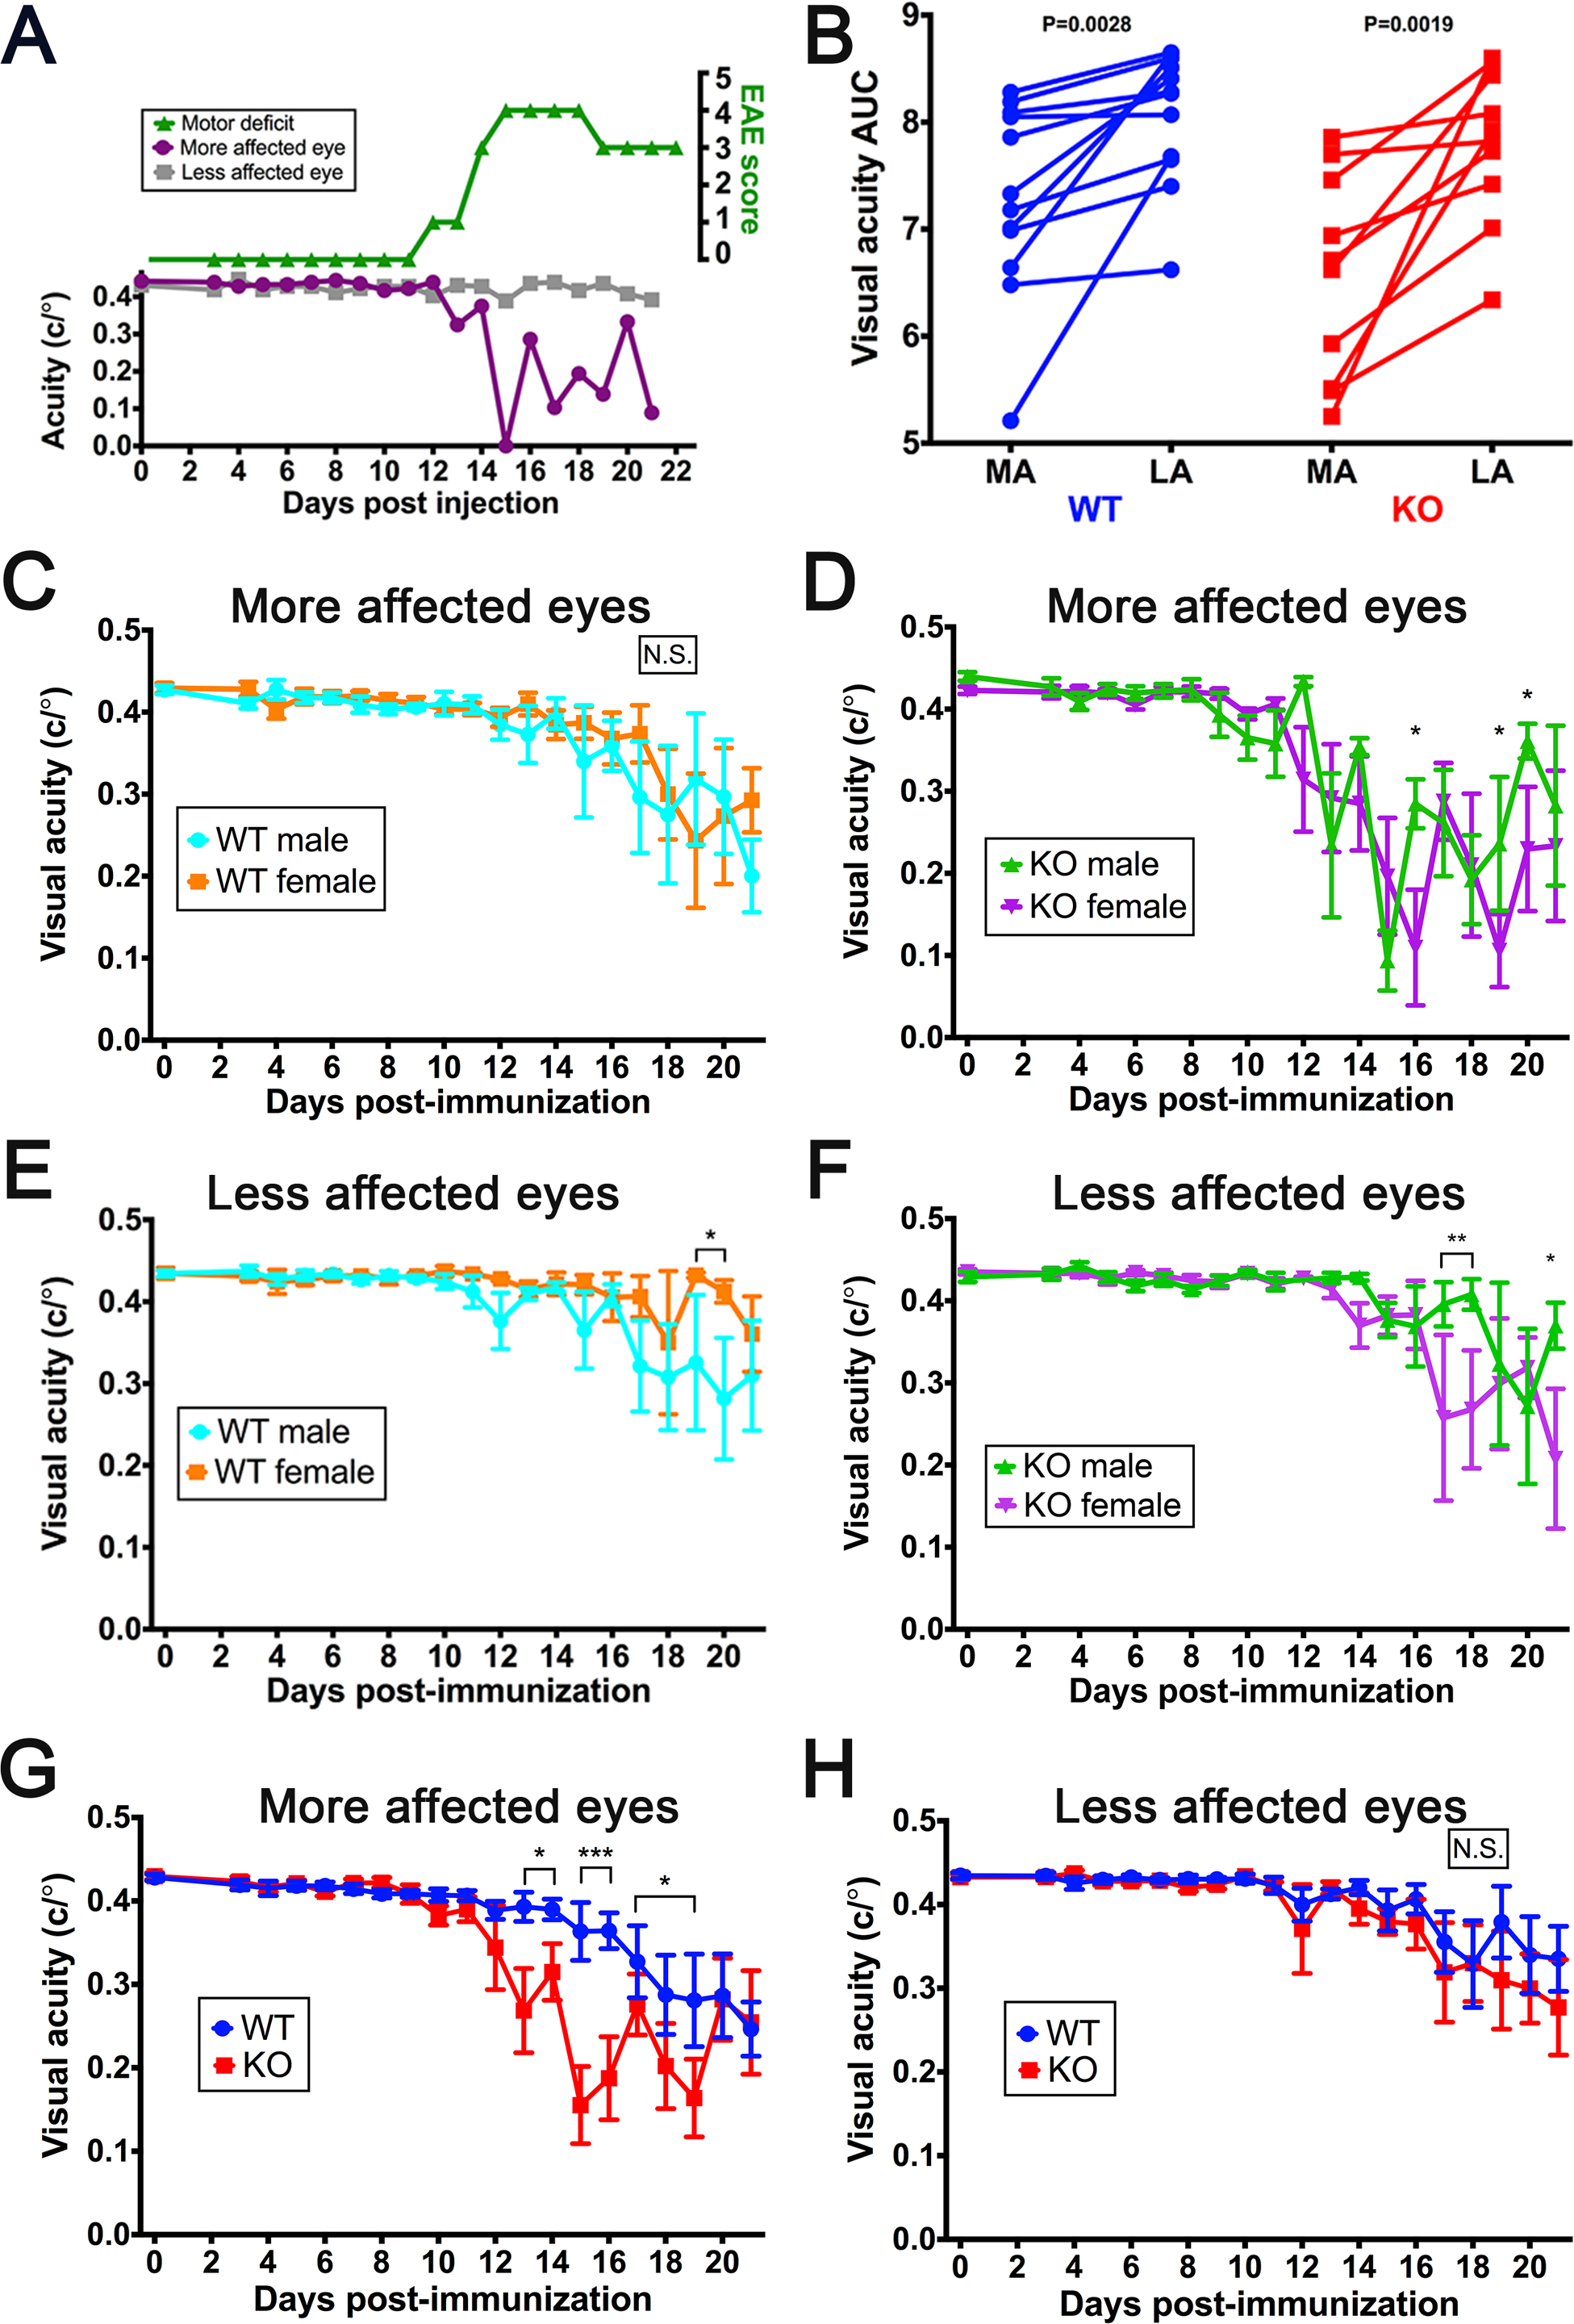
 Figure 3 of
Larabee, Mol Vis 2016; 22:1503-1513.
Figure 3 of
Larabee, Mol Vis 2016; 22:1503-1513.