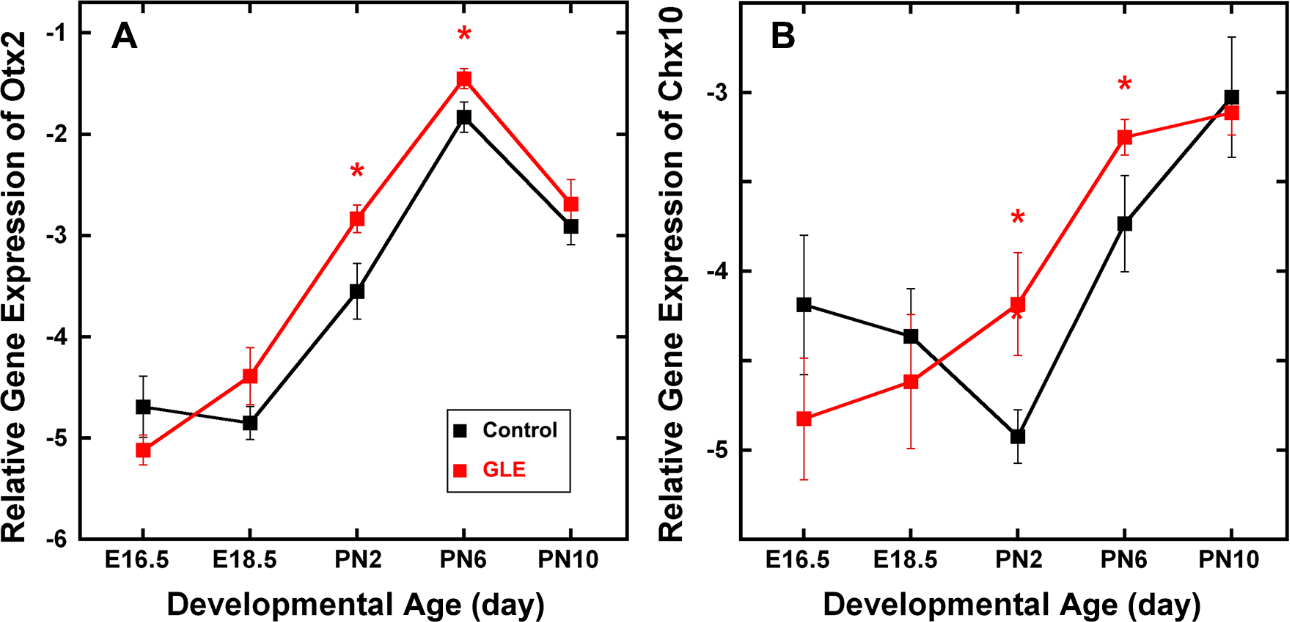
Figure 6. GLE increased gene expression of
Otx2 and
Chx10 (
Vsx2) in developing retinas. In the control and GLE retinas, (
A)
Otx2 and (
B)
Chx10 gene expression significantly increased from E16.5 to PN10.
A: For
Otx2, the pattern of expression was similar in the control and GLE retinas, peaking at PN6, when most late-born retinal neurons
were differentiated [
29]. In the GLE retinas,
Otx2 expression significantly increased at PN2 and PN6 relative to the age-matched controls.
B: For
Chx10, the pattern of gene expression in the control and GLE retinas differed. In the GLE retinas,
Chx10 expression significantly increased at PN2 and PN6 relative to the age-matched controls. The mean ± SEM values represent the
triplicate samples from four to five animals per treatment group per age. The values with an asterisk indicate p < 0.05 compared
to the control retinas. GLE = Gestational lead exposure; E = embryonic; PN= postnatal; SEM = standard error of the mean.
 Figure 6 of
Chaney, Mol Vis 2016; 22:1468-1489.
Figure 6 of
Chaney, Mol Vis 2016; 22:1468-1489.