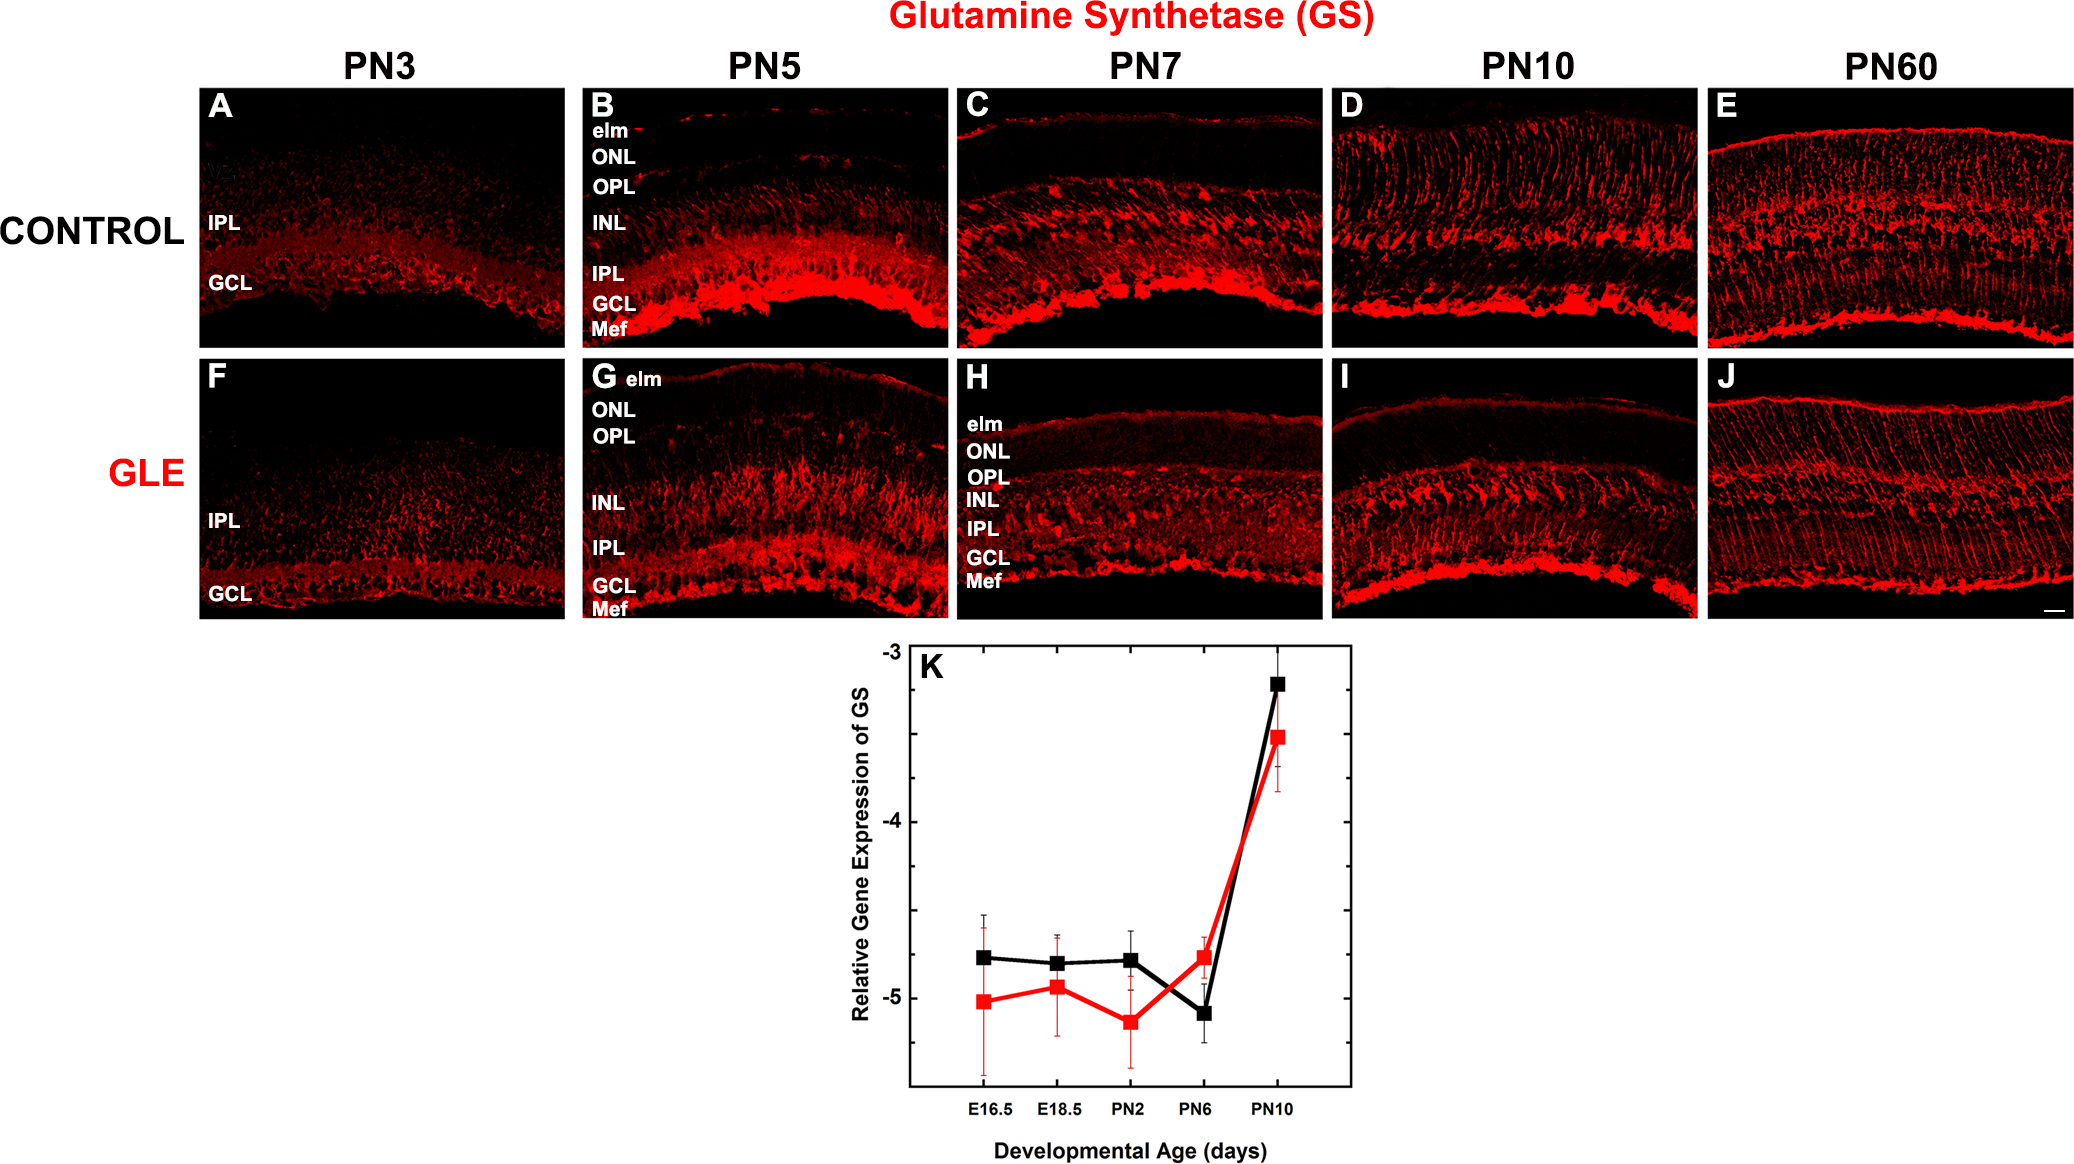
Figure 5. GLE did not alter GS protein or gene expression in developing retinas. The developing and adult retinas from (
A–E) control and (
F–J) GLE mice were labeled with an antibody against GS. GS exhibited an age-dependent increase in expression from PN3 to PN60.
A and
F: At PN 3, only the proximal retina was labeled.
B and
G: By PN5, the entire retina was immunolabeled.
C, D,
H, and
I: PN7 and PN10 images show that the GS-IR labeling pattern became more organized as the retina developed.
E and
J: The intensity of GS-IR Müller glial cells was not different in PN60 control and GLE retinas, as previously described [
21]. The number of cyclin D3-IR Müller glial cells in the PN60 control and GLE retinas was not different [
21]. Scale bar = 40 μm.
K: In the control and GLE retinas, GS gene expression (
Glul) was low from E16.5 to PN10 and then increased at PN10. There were no significant differences at any age. The mean ± SEM
values represent the triplicate samples from four to five animals per treatment group per age. GLE = Gestational lead exposure;
GS = glutamine synthetase; PN = postnatal; E = embryonic; SEM = standard error of the mean.
 Figure 5 of
Chaney, Mol Vis 2016; 22:1468-1489.
Figure 5 of
Chaney, Mol Vis 2016; 22:1468-1489.