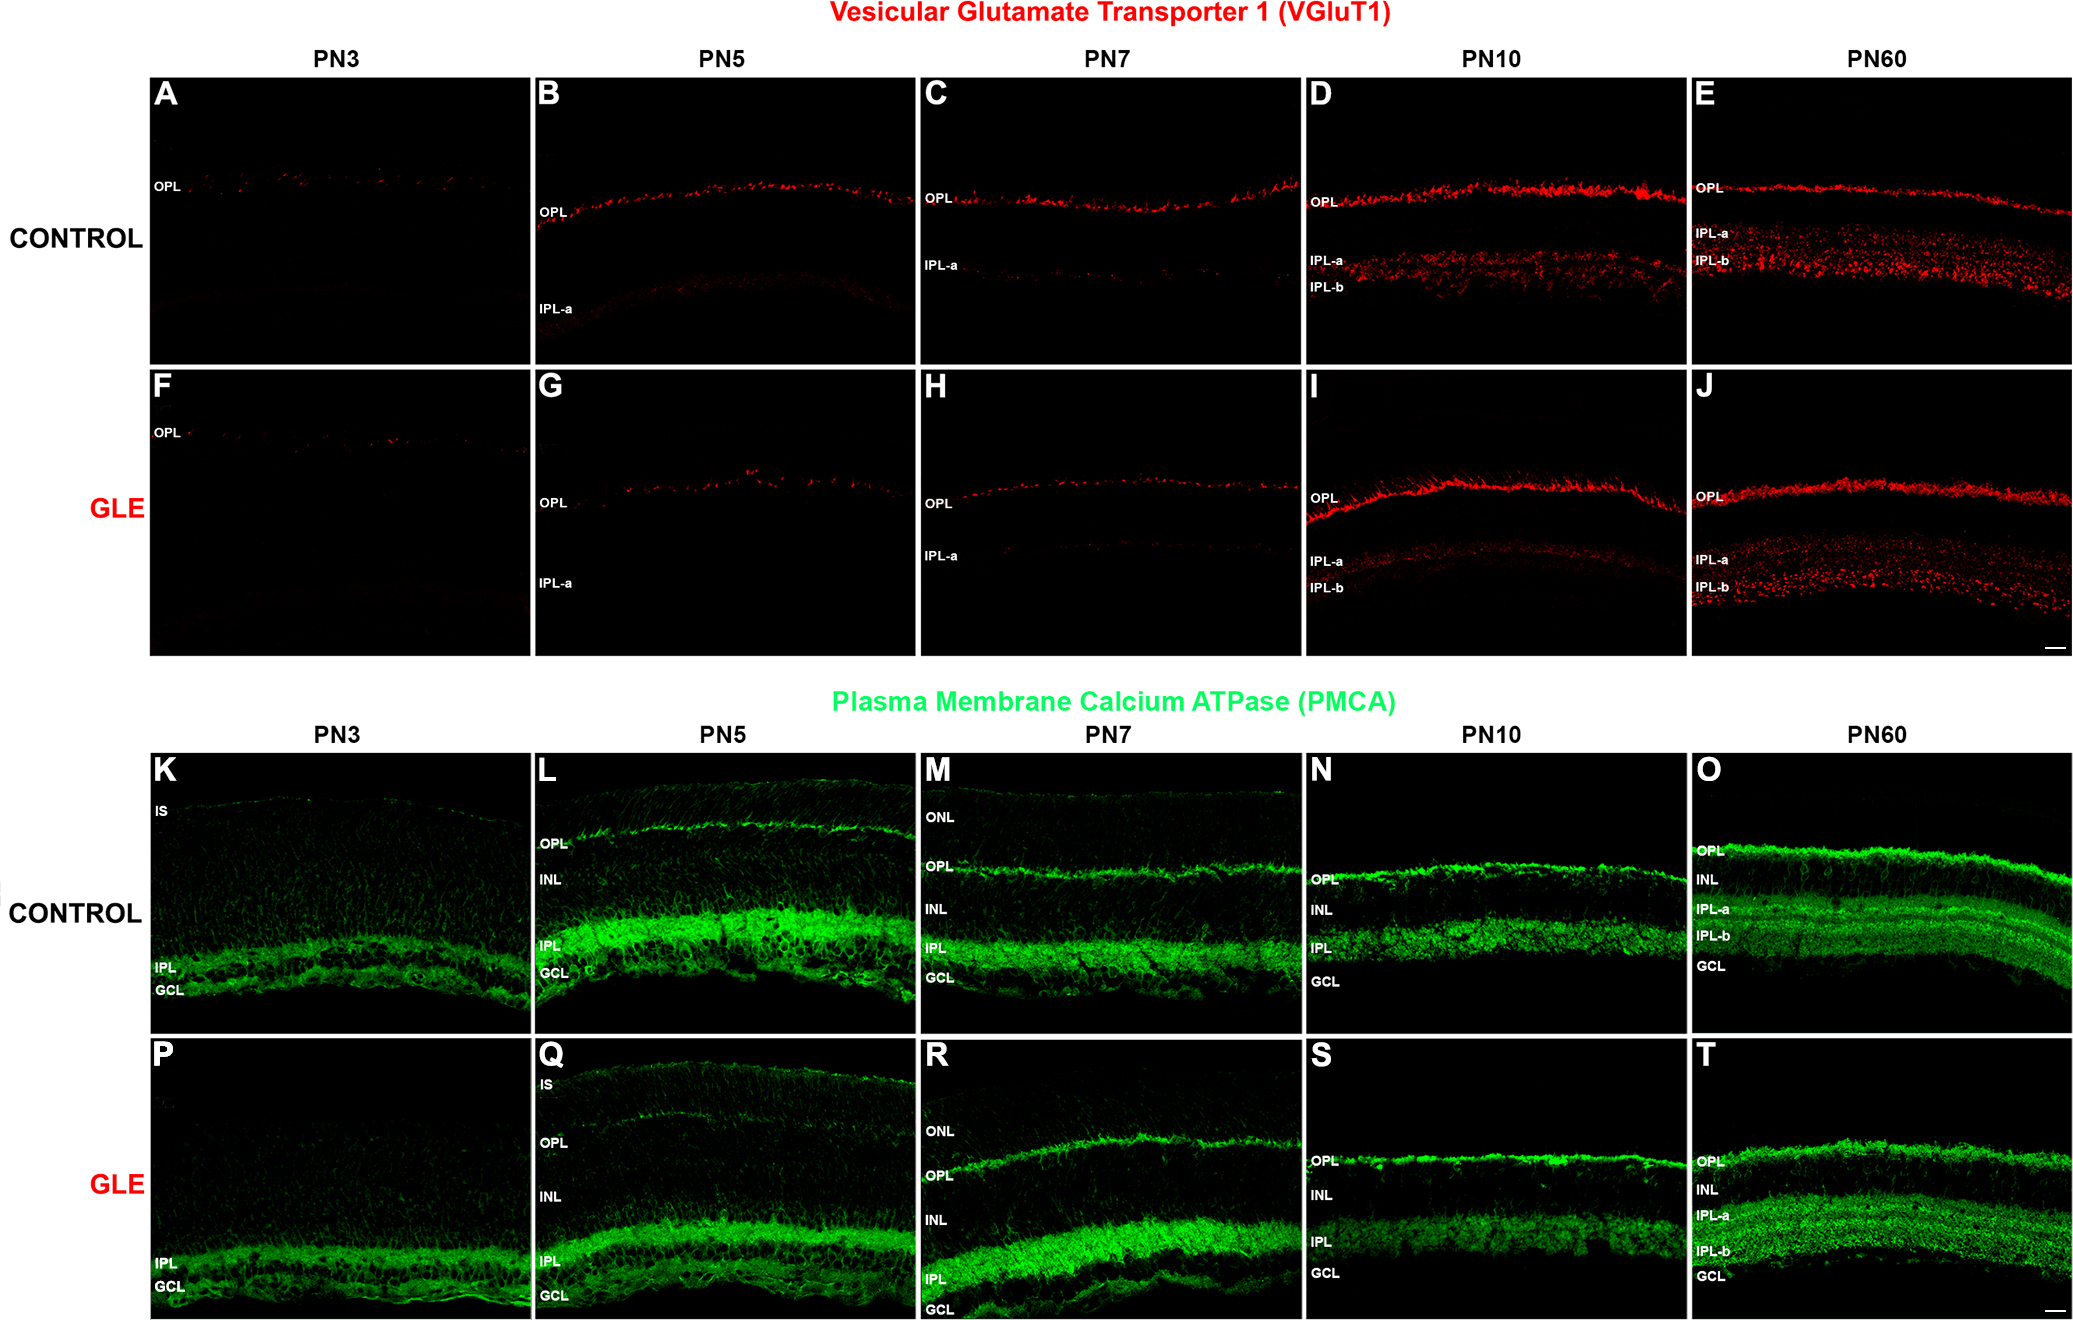
Figure 10. GLE delayed the synaptic expression of VGluT1 and PMCA in developing plexiform layers. The developing retinas from (
A–E) the control and (
F–J) GLE mice were labeled with an antibody against VGluT1.
A: In the PN3 controls, sporadic VGluT1- IR was seen in the OPL.
B–C: In the PN5 and PN7 retinas, the VGluT1-IR amount and intensity increased in the OPL and was seen in IPL-a (OFF layer).
D: At PN10, the VGluT1-IR in the OPL laminated into discrete puncta in the distal (rod spherules) and clumps in the proximal
(cone pedicles) layers as well as into IPL-a and IPL-b (ON layer).
E: At PN60, the adult pattern of the VGluT1 occurred in the OPL and IPL.
F–G: In the PN3 and PN5 GLE retinas, the sporadic VGluT1-IR occurred in the OPL. In contrast to the controls, the IPL-a was not
have the VGluT1-IR at PN5.
H: In the PN7 retinas, a minimal amount of VGluT1-IR was seen in the OPL and IPL-a.
I: At PN10, the VGluT1-IR in the OPL increased in the GLE retinas and was similar to the controls. Although the VGluT1-IR was
present in IPL-a, only a minimal amount occurred in IPL-b. Thus, the GLE caused a two- to three-day delay in the appearance
and development of the age-matched extent and intensity of VGluT1-IR in the OPL and IPL (
Table 3).
J: At PN60, the amount and intensity of VGluT1 in the OPL and IPL of the GLE retinas increased relative to the age-matched controls
such that the layers were thicker. The developing retinas from (
K–O) the control and (
P–T) GLE mice were labeled with an antibody against pan-PMCA.
K: In the PN3 controls, PMCA-IR was seen in ISs and throughout the IPL and GCL.
L–M: In the PN5 and PN7 retinas, PMCA-IR was visible in the ISs and intensely labeled the OPL, IPL, and GCL.
N: At PN10, PMCA-IR was more localized. Intensely PMCA-IR occurred in the OPL and IPL, and labeling was visible in the distal
and proximal INL.
O: At PN60, PMCA-IR laminated in the OPL such that the distal layer (rod spherules) was intensely labeled, whereas the proximal
OPL (cone pedicles) was only lightly labeled. Somas occurred throughout the INL in the PMCA-IR somas were observed throughout
the INL. Intense PMCA-IR was observed in both the IPL-a and IPL-b.
P: In the PN3 GLE retinas, PMCA-IR occurred in the IPL and GCL but not in ISs.
Q: In the PN5 GLE retinas, PMCA-IR occurred in the ISs but was less intense in the OPL, IPL, and GCL compared to the age-matched
controls.
R–S: At PN7 and PN10, the pattern of PMCA-IR was similar in the control and GLE retinas. Thus, GLE caused a two-day delay in the
appearance and development of the age-matched extent and intensity of PMCA-IR in the ISs and OPL (
Table 3).
T: At PN60, the pattern of PMCA-IR was similar in the control and GLE retinas, except that the distal OPL and entire IPL were
thicker and had more intense PMCA-IR in the GLE retinas. Scale bars = 40 μm. GLE = Gestational lead exposure; VGluT1 = vesicular
glutamate transporter 1; PMCA = plasma membrane calcium ATPase; PN = postnatal; IR = immunoreactivity; OPL = outer plexiform
layer; IPL = inner plexiform layer; GCL = ganglion cell layer; INL = inner nuclear layer.
 Figure 10 of
Chaney, Mol Vis 2016; 22:1468-1489.
Figure 10 of
Chaney, Mol Vis 2016; 22:1468-1489.