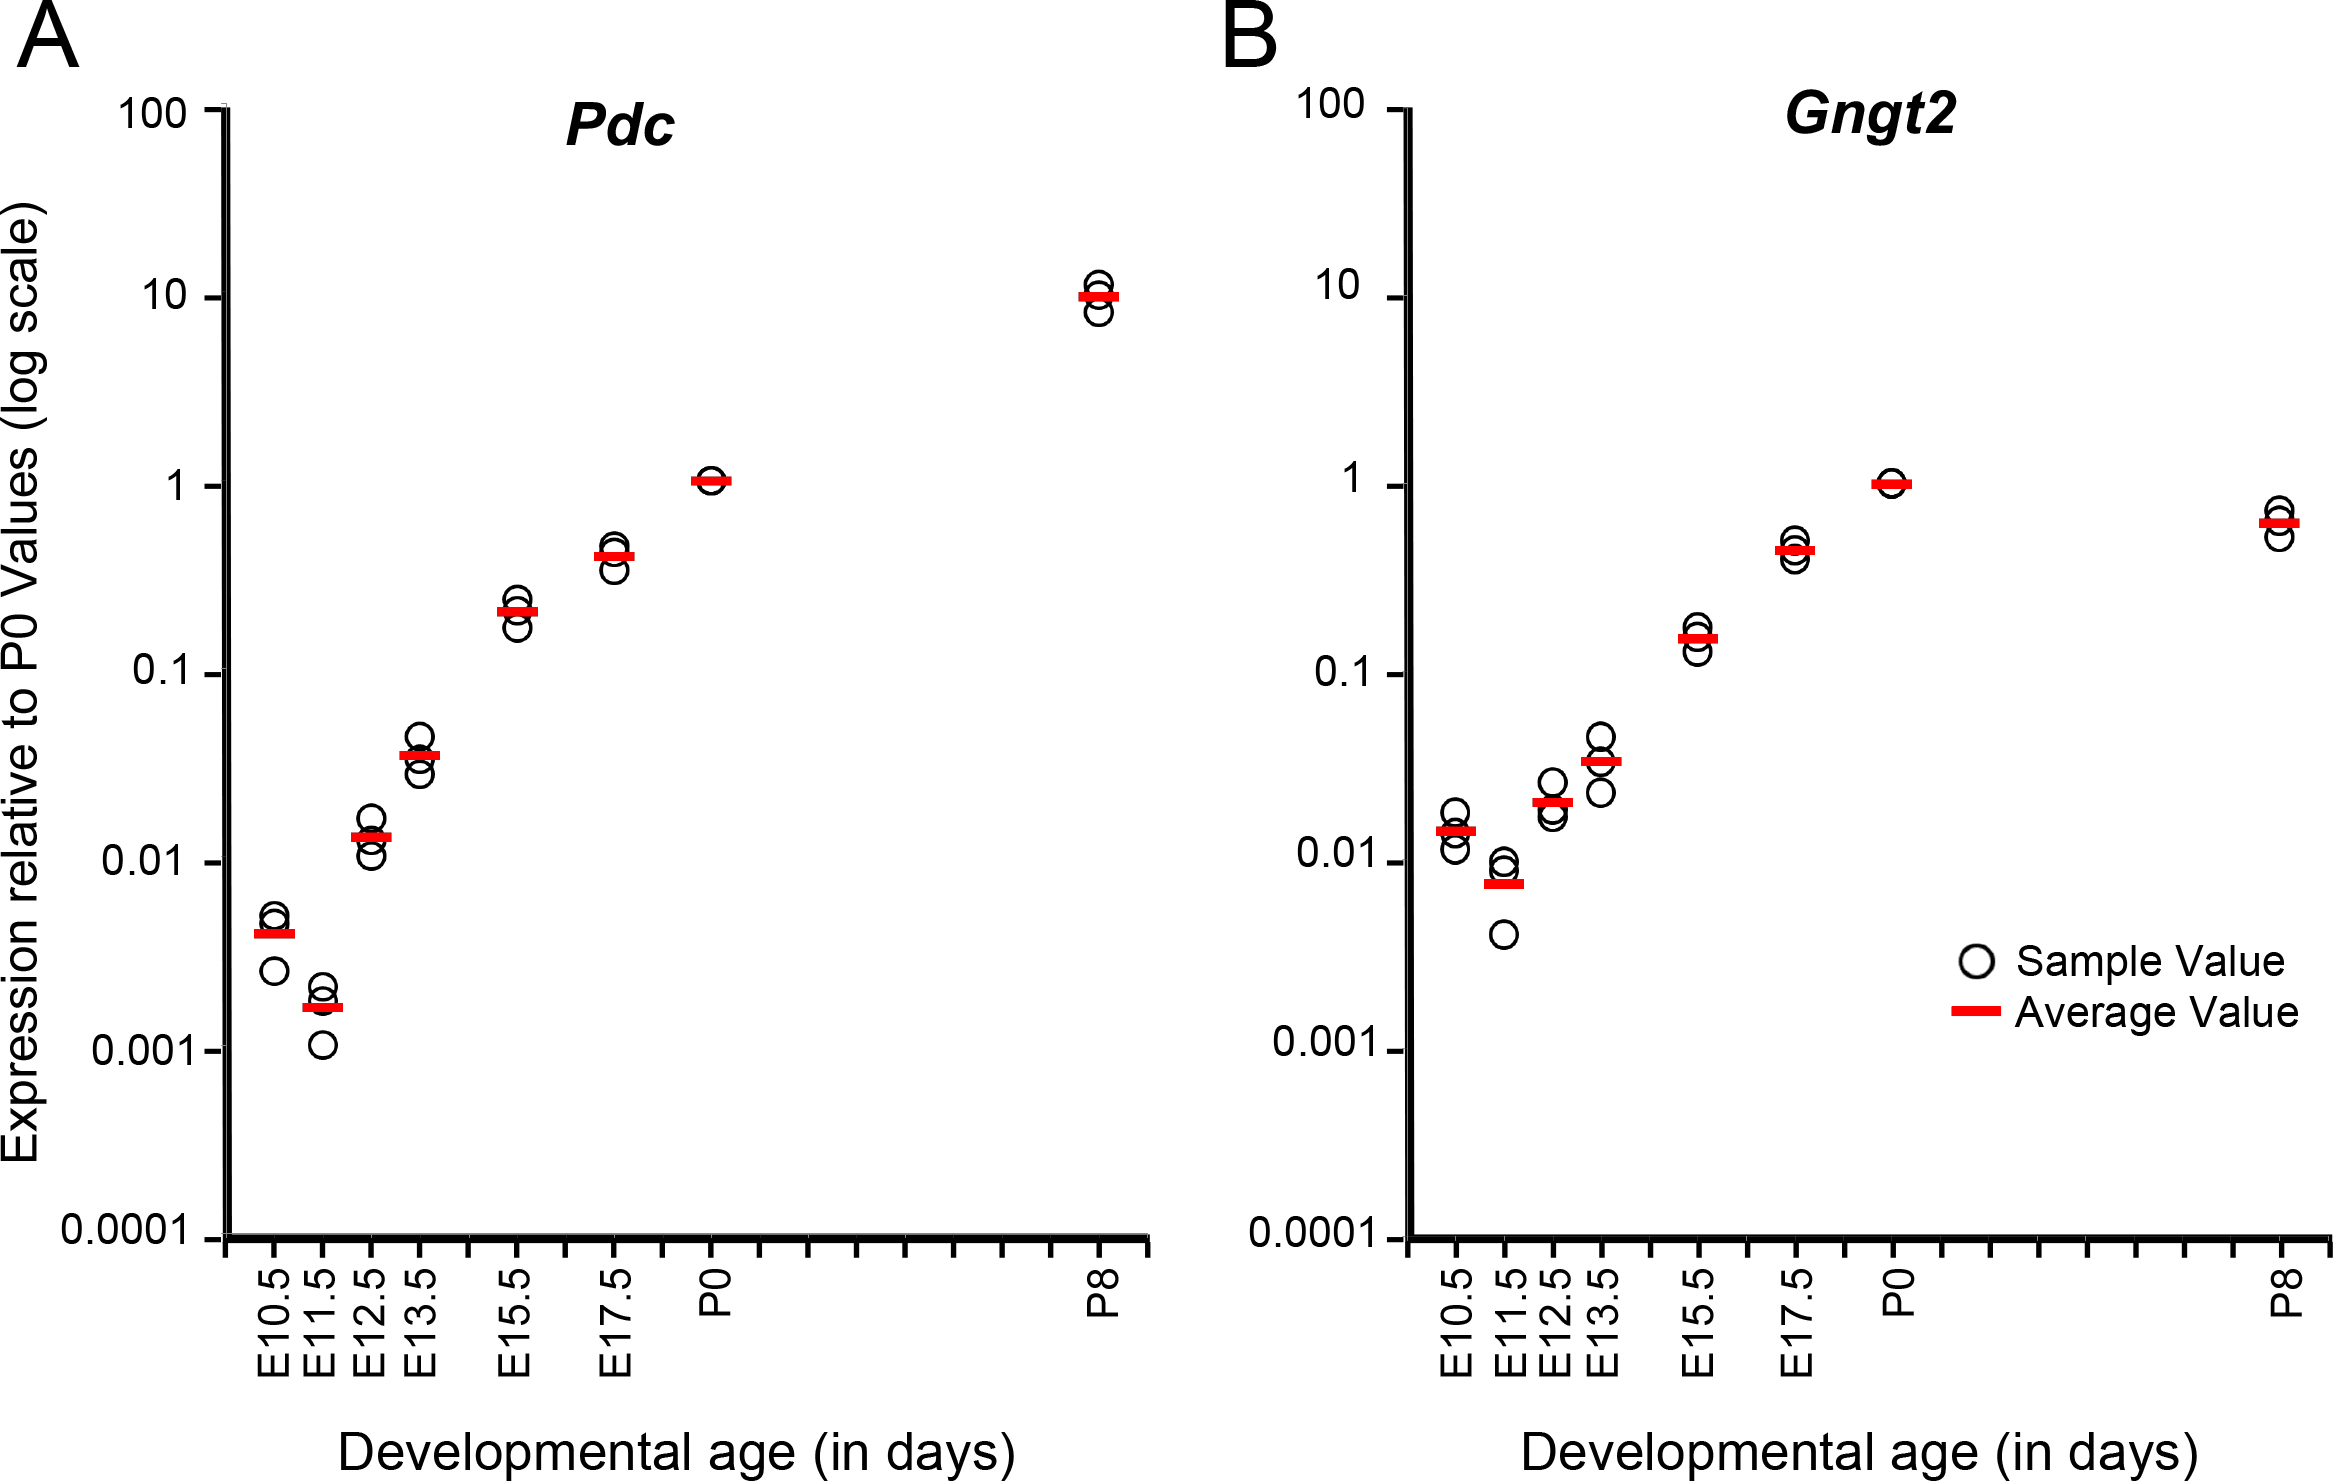
Figure 6. mRNA expression across developmental ages measured with qPCR.
A:
Pdc expression above the threshold was detected with qPCR at E10.5 and E11.5 but at extremely low levels. The relative
Pdc expression levels increase at E12.5, which is consistent with protein expression (see
Figure 1). Expression increases gradually through P0, and then at P8, there is a dramatic increase in the
Pdc mRNA levels.
B: Expression of
Gngt2 mRNA is detected with qPCR at E10.5 and E11.5, but similar to phosducin, at low levels. A steady increase in
Gngt2 expression occurs from E12.5 to P0. The
Gngt2 levels at P8 decrease slightly relative to the P0 values. All numbers are expressed relative to P0 and normalized to the
Hprt levels in each sample and graphed on a log scale. At each age, three independent samples were collected, and each of these
samples was run in triplicate as technical replicates. Red lines indicate the average for that age group; black circles are
individual samples at each age group.
 Figure 6 of
Rodgers, Mol Vis 2016; 22:1455-1467.
Figure 6 of
Rodgers, Mol Vis 2016; 22:1455-1467.