Figure 5. Colocalization of phosducin and cone transducin γ expression in the retina. Fluorescent imaging of coronal sections of mouse
retina from E13.5-P8 (A–E) was performed using anti-phosducin and anti-cone transducin γ antibodies. Both markers localized almost exclusively to the
ventricular surface at all ages tested. Scale bars = 50 µm. Quantification of the colabeled cell for ages E13.5–P0 (F) shows a high percentage of colabeled cells (97% ±0.4%; SD) at E13.5 that progressively decreased with age (E15.5 was 88%
±1.1%; E17.5 was 87% ± 2.3%; P0 was 79% ±6.2%). Phosducin-only cells comprised 2.4% ±1.1% at E13.5, 11.3% ±1.3%, at E15.5,
12.3% ±2.2% at E17.5, and 20% ±6.6% at P0. Cone transducin γ–only cells constituted 0.8% ±0.7% at E13.5, 1% ±0.04% at E15.5,
1% ±0.4% at E17.5, and 1.2% ±0.7% at P0. The blue bars indicate cells that are colabeled, the phosducin-only cells are shown
in red, the cone transducin γ–only cells appear in green, and the error bars represent standard deviations.
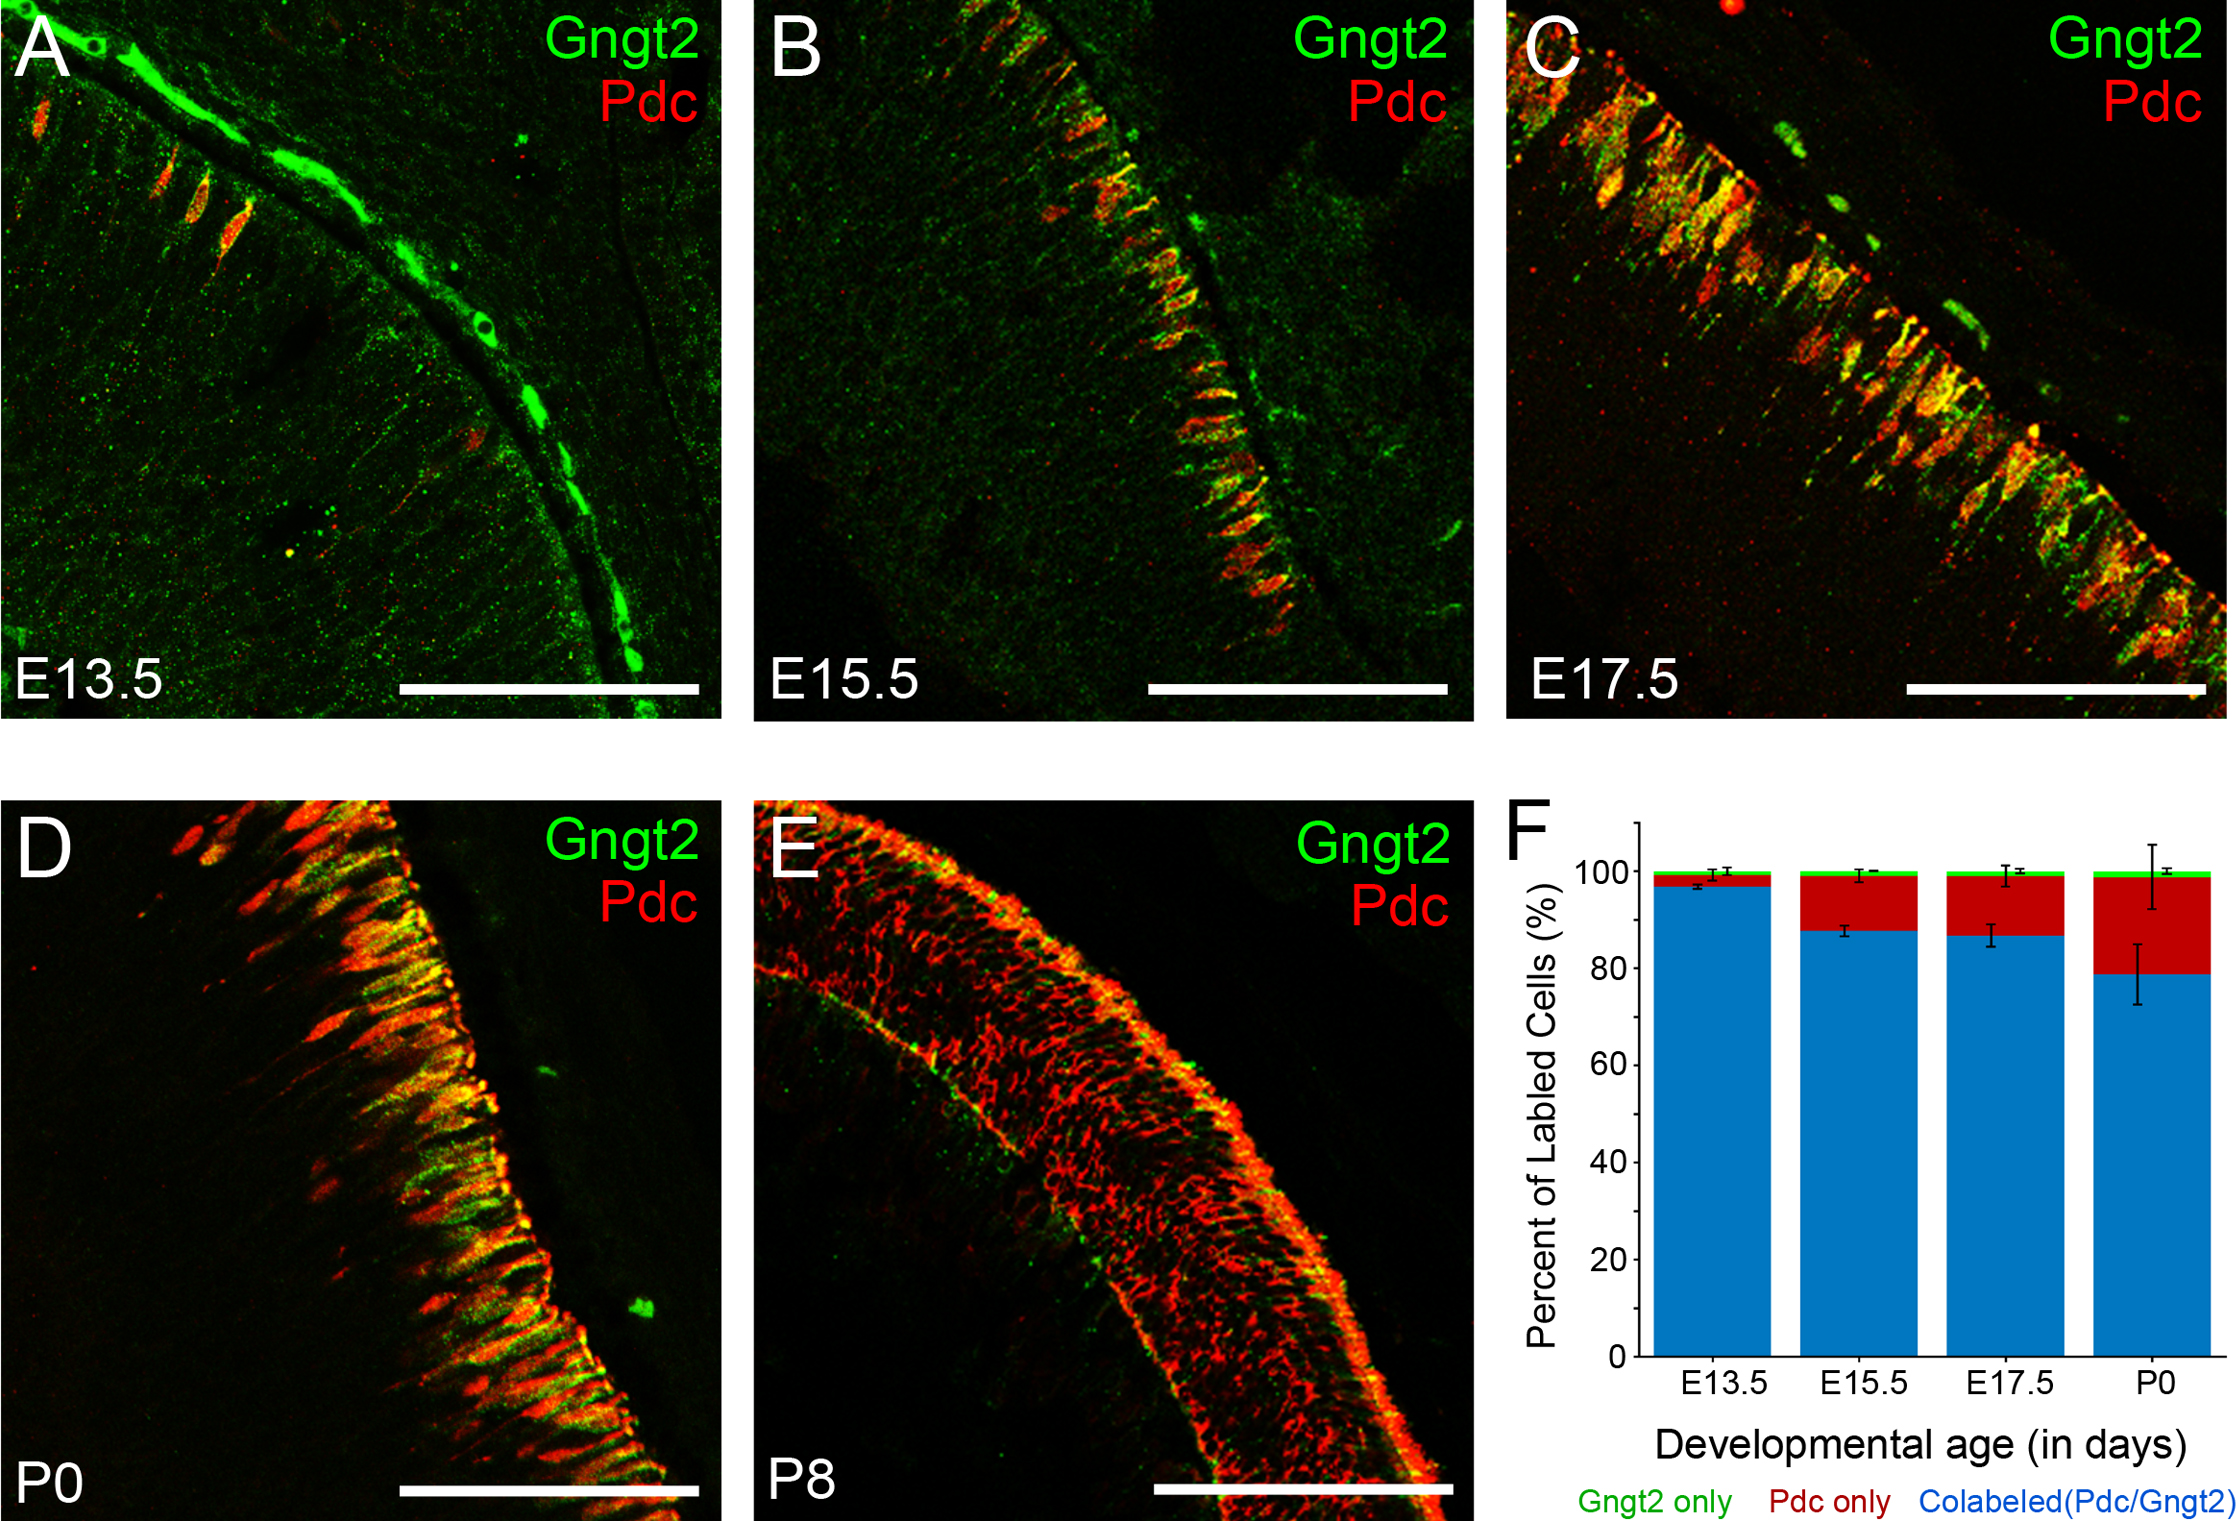
 Figure 5 of
Rodgers, Mol Vis 2016; 22:1455-1467.
Figure 5 of
Rodgers, Mol Vis 2016; 22:1455-1467.