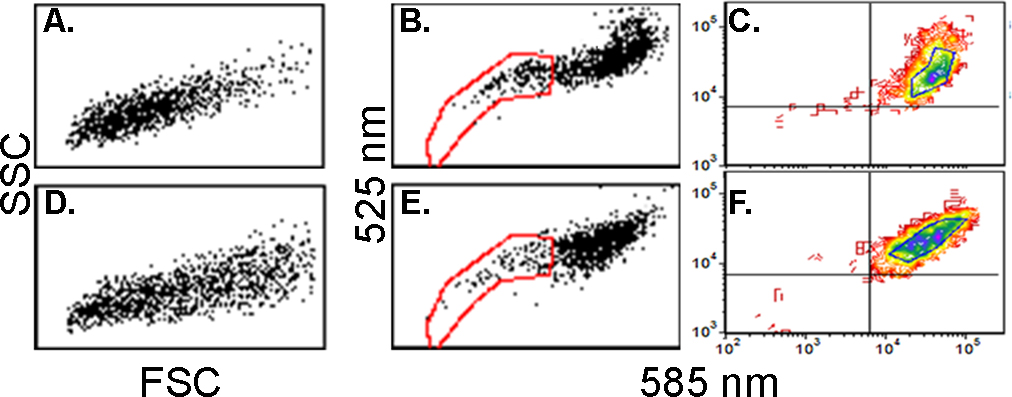
Figure 1. Scatter and JC1 exclusion in cells grown on hAM or Falcon substrata.
A–
C: Cells from explants cultured over human amniotic membrane (hAM).
D–
F: Cells from cultures on synthetic membrane.
A and
D: Scatter plots.
B–
F: JC1 bivariate emission dot plots. Note the distinct shape of the main cell cohort.
C and
F: Contour plots. The demarcated area at the center of the plot was used to determine the emission intensities and the intensity
ratios described in
Table 1.
 Figure 1 of
Selver, Mol Vis 2016; 22:138-149.
Figure 1 of
Selver, Mol Vis 2016; 22:138-149.