Figure 3 of
Srivastav, Mol Vis 2016; 22:1352-1360.
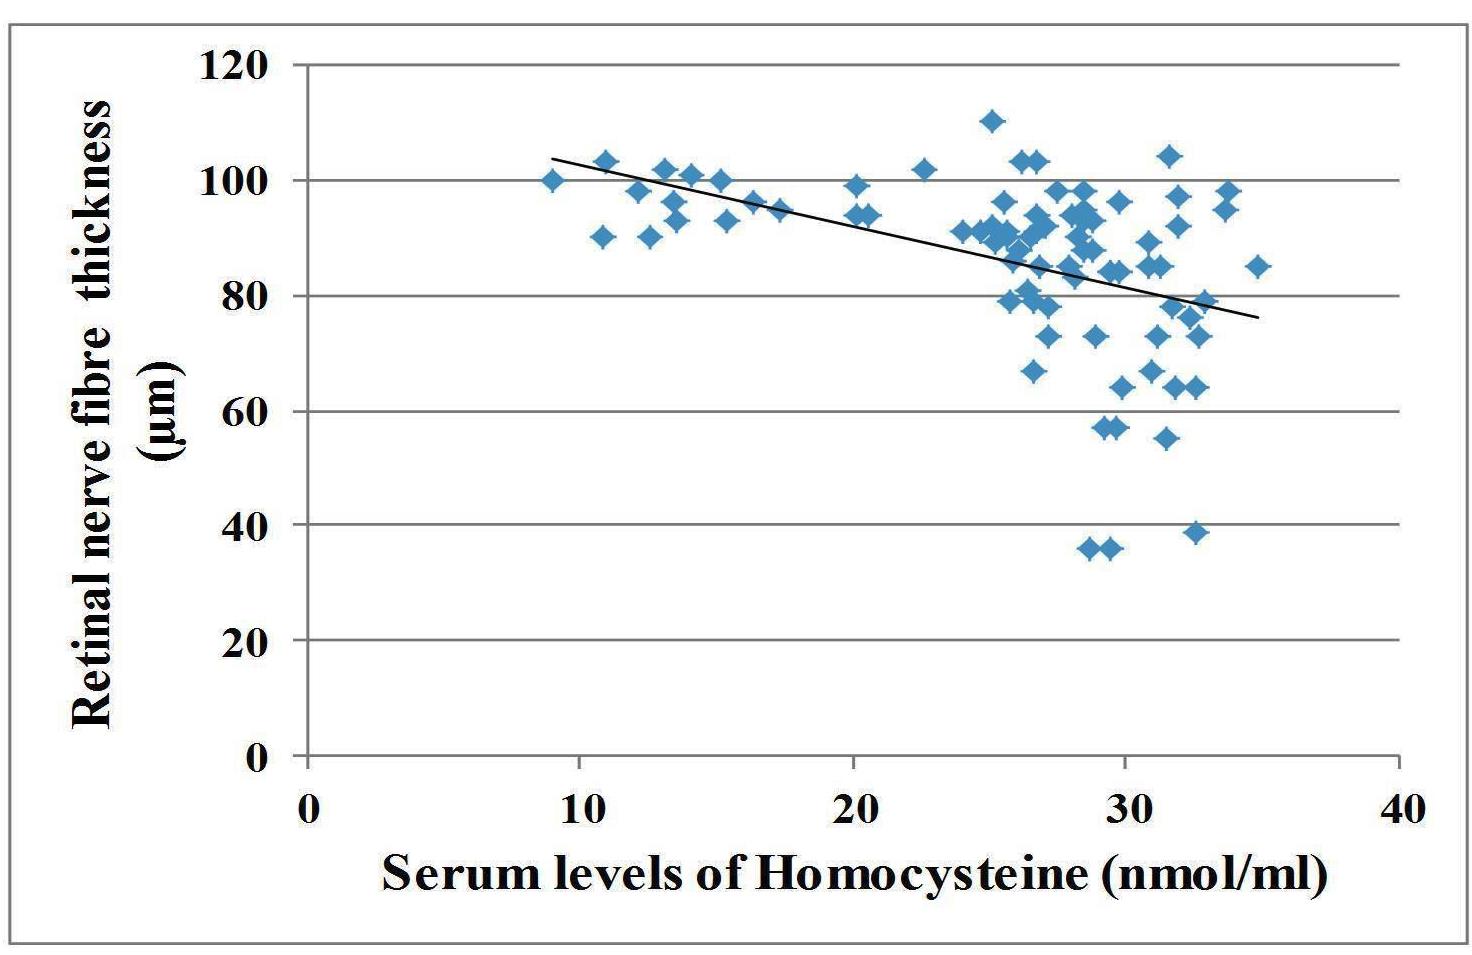
Figure 3.
Scatter plot showing a negative correlation between the serum levels of homocysteine and the average retinal nerve fiber layer thickness observed on Pearson correlation analysis.
 Figure 3 of
Srivastav, Mol Vis 2016; 22:1352-1360.
Figure 3 of
Srivastav, Mol Vis 2016; 22:1352-1360.