Figure 2. Box and whisker plot graphically representing the descriptive statistics for serum levels of homocysteine among the study
groups. The horizontal line within the box indicates the median, boundaries of the box indicate the 25th- and 75th -percentile,
and the whiskers indicate the highest and lowest values. An increase in serum level of homocysteine with increase in severity
of diabetic retinopathy is observed.
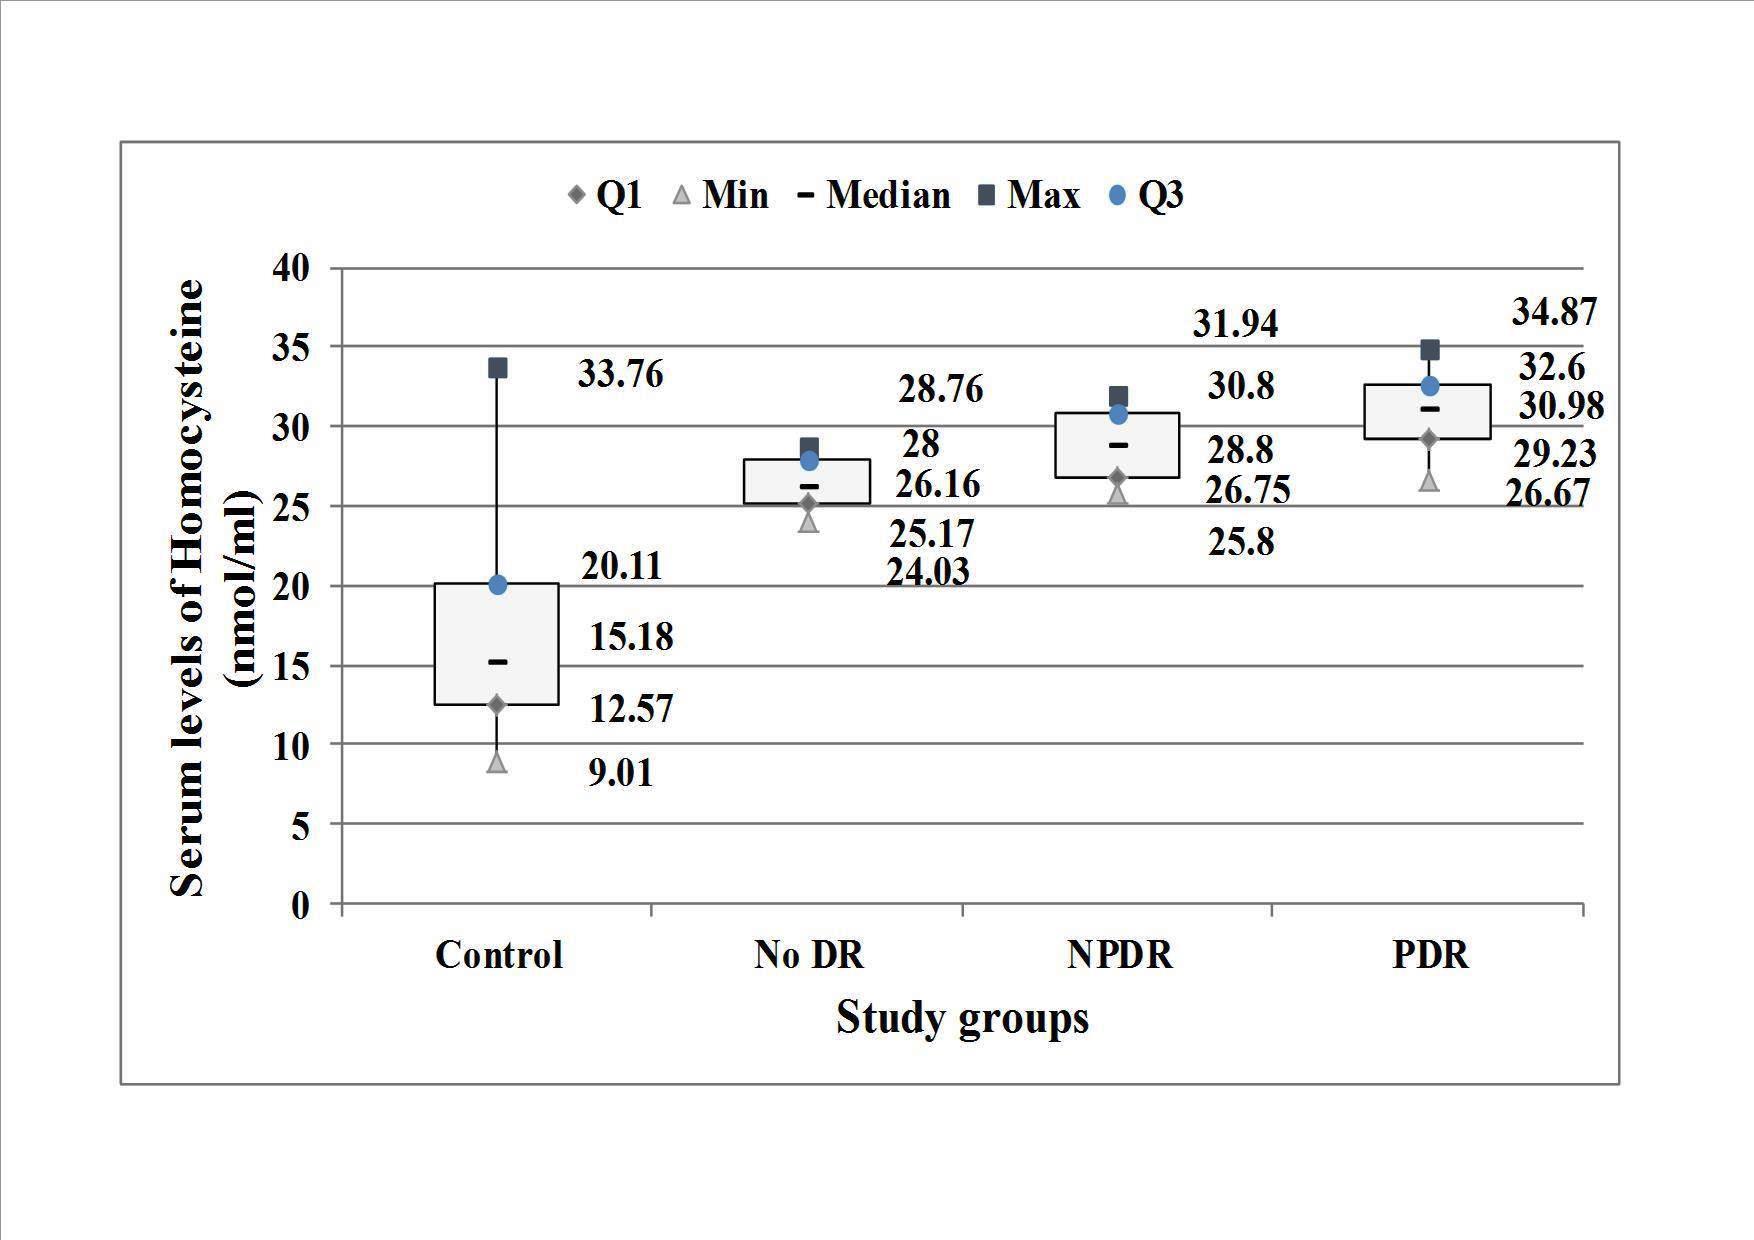
 Figure 2 of
Srivastav, Mol Vis 2016; 22:1352-1360.
Figure 2 of
Srivastav, Mol Vis 2016; 22:1352-1360.