Figure 1. Retinal nerve fiber thickness analysis using optic disc cube 200x200 feature depicting thickness map, thickness deviation,
TSNIT (Temporal, Superior, Nasal, Inferior, Temporal ) normative data and extracted tomograph of both eyes. The quadrant map
shows thinning in the superior quadrant of both eyes and thinning in inferior quadrant of left eye.
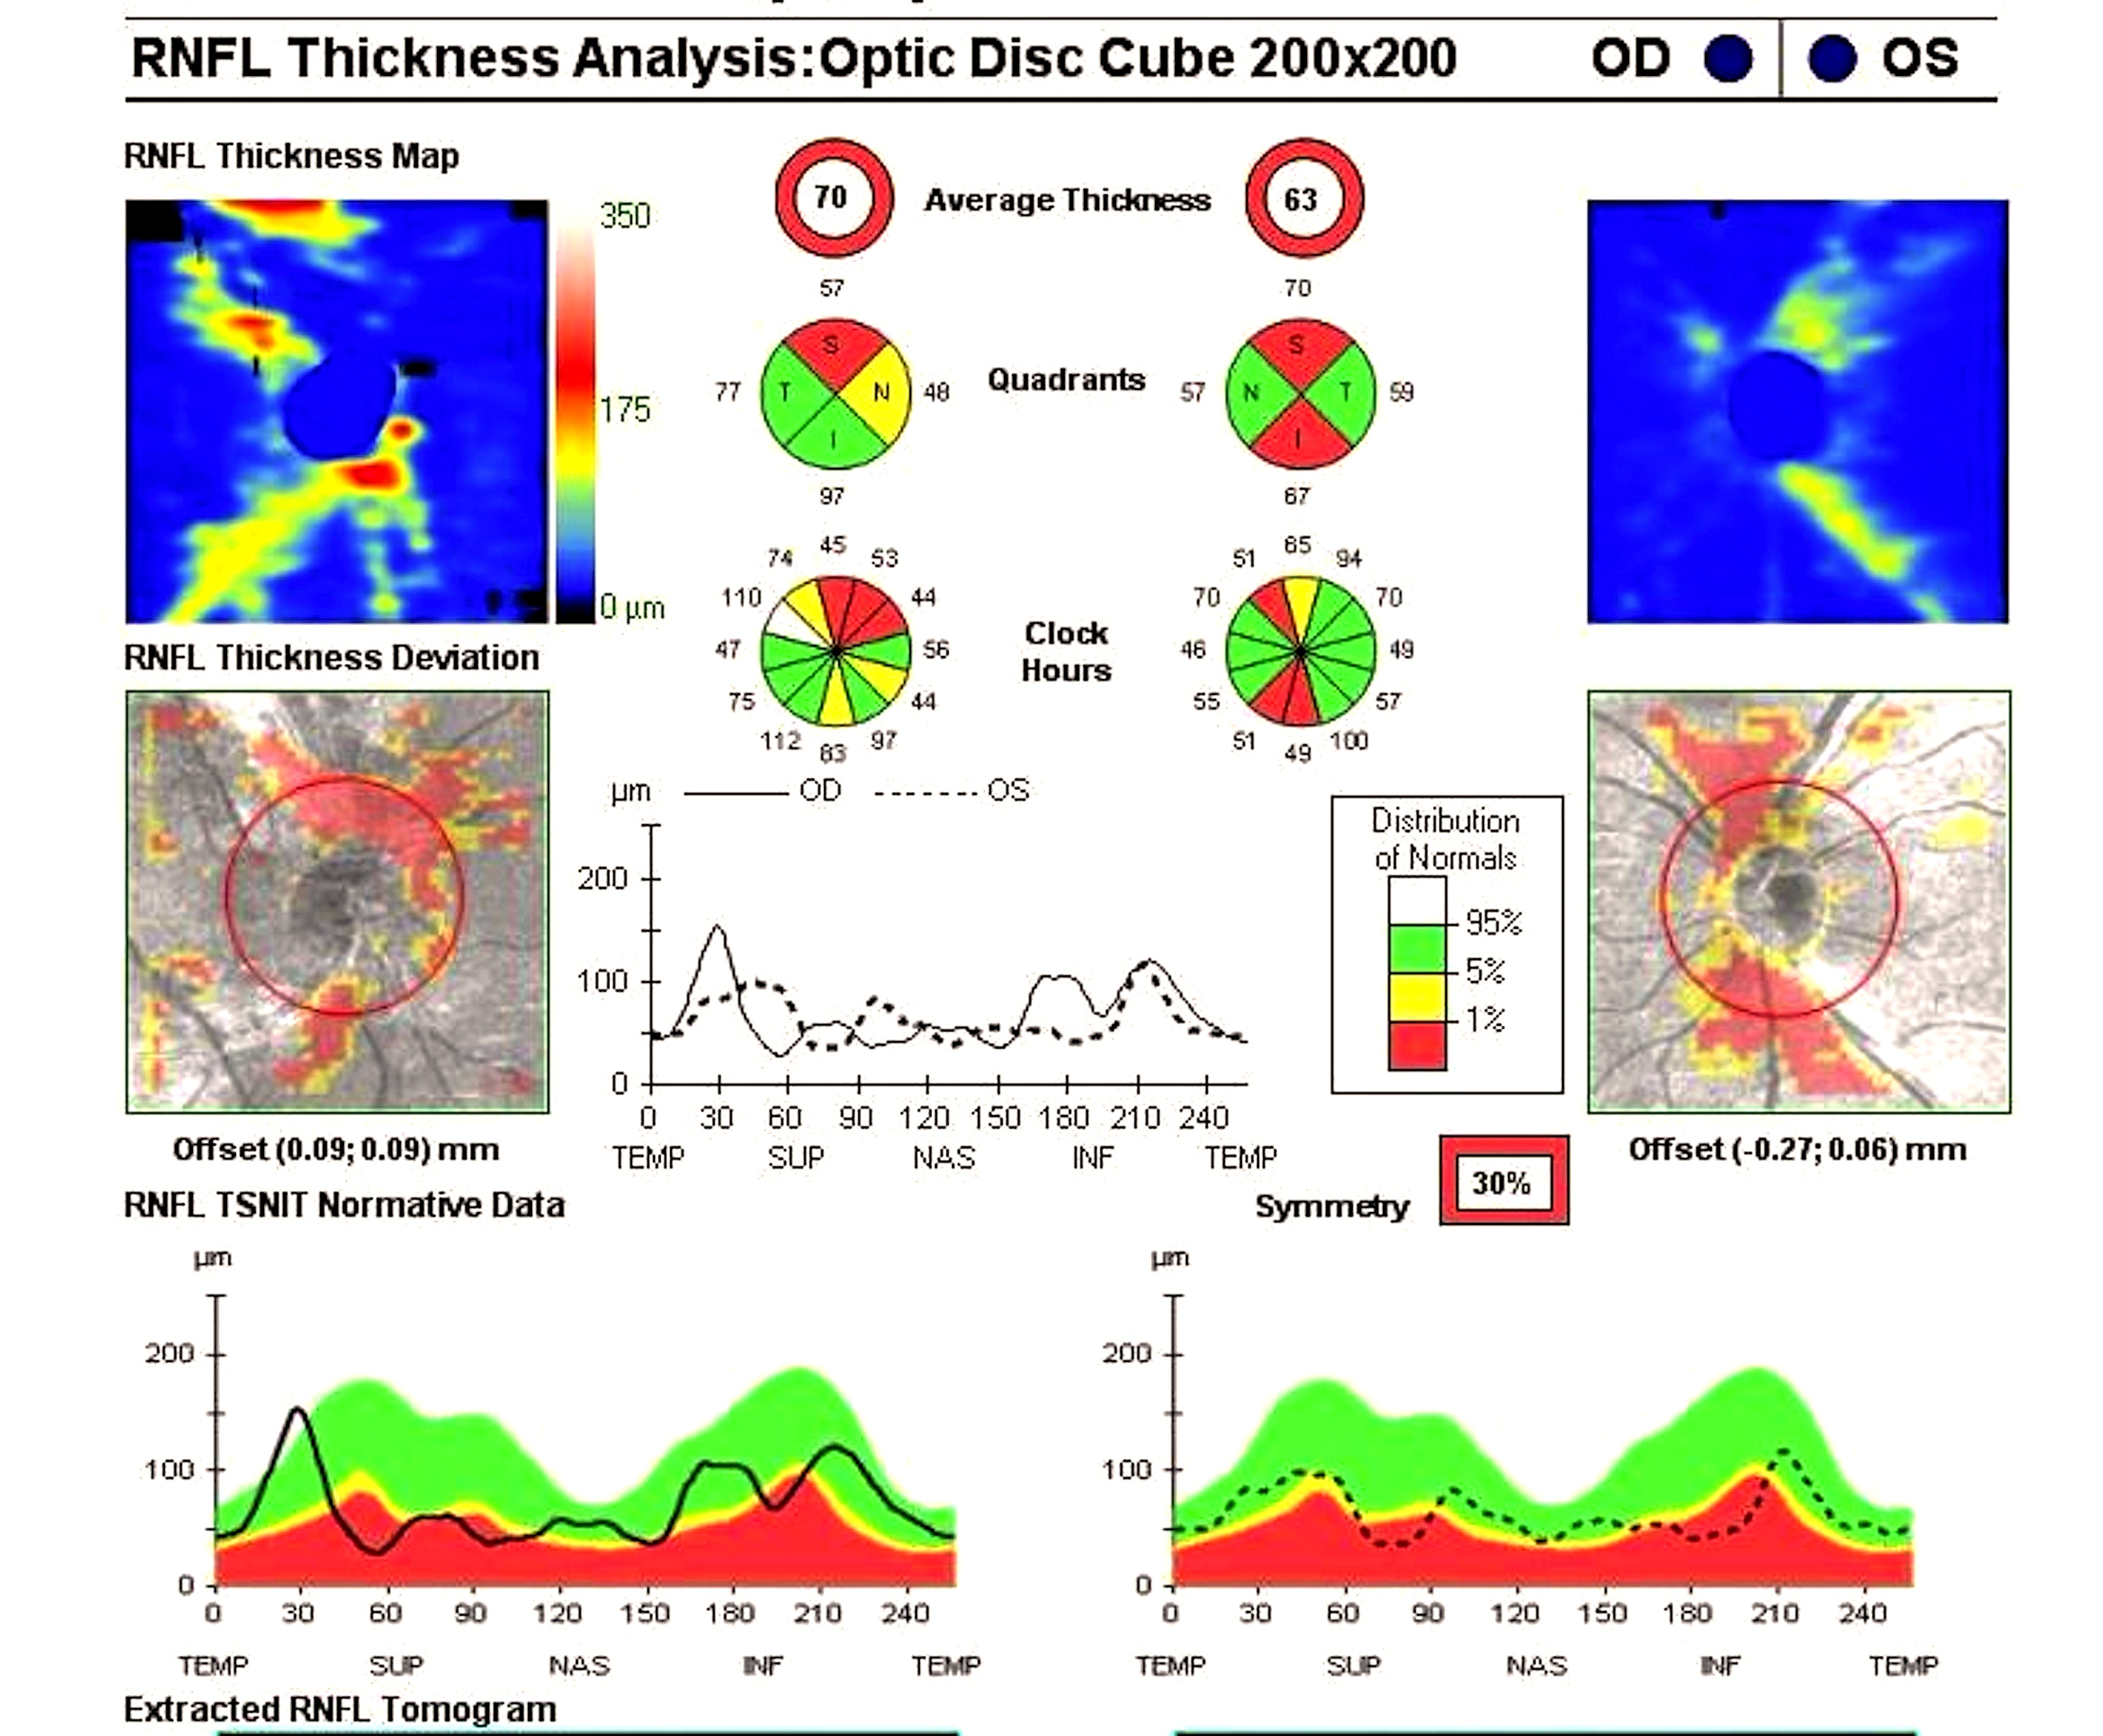
 Figure 1 of
Srivastav, Mol Vis 2016; 22:1352-1360.
Figure 1 of
Srivastav, Mol Vis 2016; 22:1352-1360.