Figure 3. Mixed electroretinogram showing rod- and cone-driven responses 24 h after intravitreal injection of saline solution or three
different doses of rtPA (2.16, 0.54, and 0.27 µg in 5 µl) in healthy rats. A: Variation in the a-wave amplitudes (µV) from the preinjection recordings. B: Variation in the b-wave amplitude (µV) from the preinjection recordings. No statistically significant difference was observed
between the recombinant tissue plasminogen activator (rtPA)- and vehicle-injected eyes.
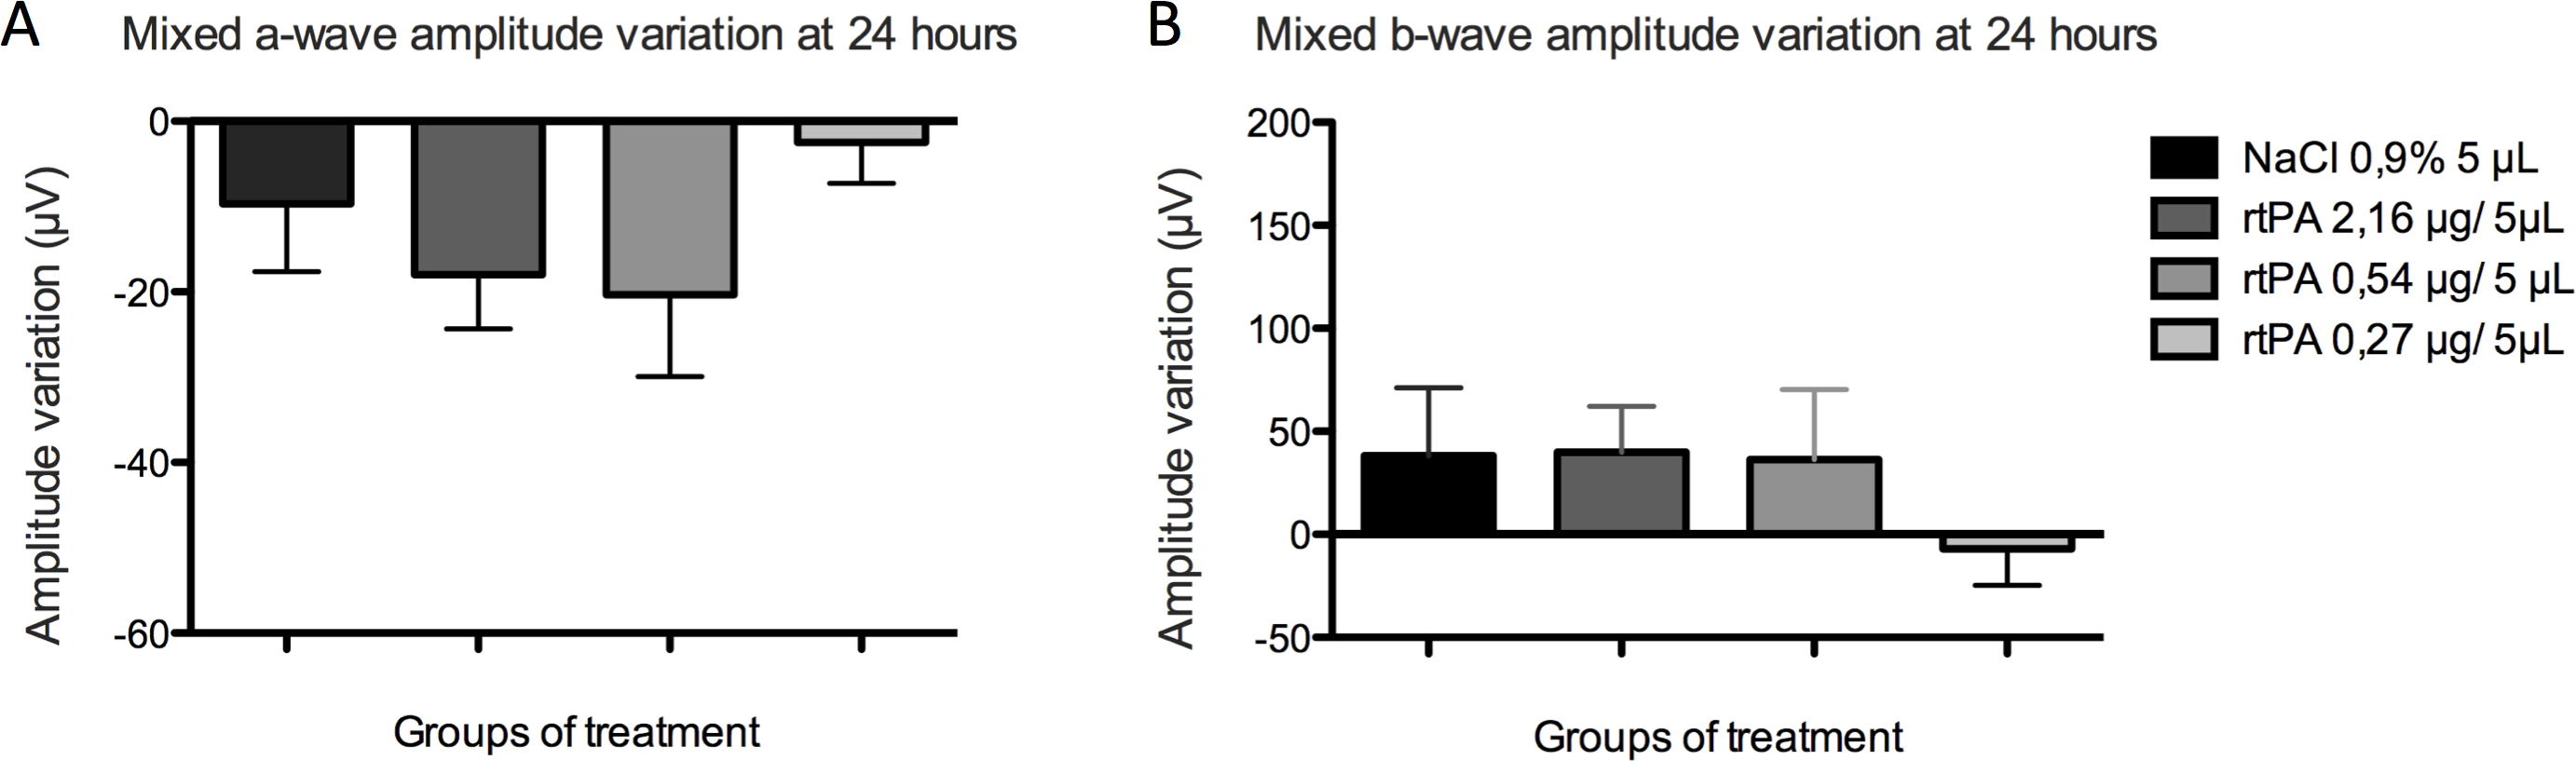
 Figure 3 of
Daruich, Mol Vis 2016; 22:1332-1341.
Figure 3 of
Daruich, Mol Vis 2016; 22:1332-1341.