Figure 4. Heat map analysis of Hspa5 covariates and candidate genes. A: Heat map of the top 100 covariates of Hspa5 as determined by the Pearson correlation analysis. Probe sets for the various genes represent columns and the genomic location
for each chromosome represents rows. Tight bands of correlates are present on Chr 2 and Chr 15 at the location of the QTL
peaks, which were revealed by simple interval mapping. B: Heat map containing B4galt5, Dpm1, Fbln1, Glt8d3, Sulf2, Pmm1, and Hspa5. The hue intensity indicates the strength of the association between gene expression and genomic location. The red and blue
colors indicate that the D or B allele increases trait values, respectively. The orange triangles show the location of each
gene on the chromosomes. B4galt5, Dpm1, Fbln1, Glt8d3, Sulf2, and Pmm1 show a strong consistency of genetic regulation across mRNA regions on Chr 2 and Chr 15 (arrows).
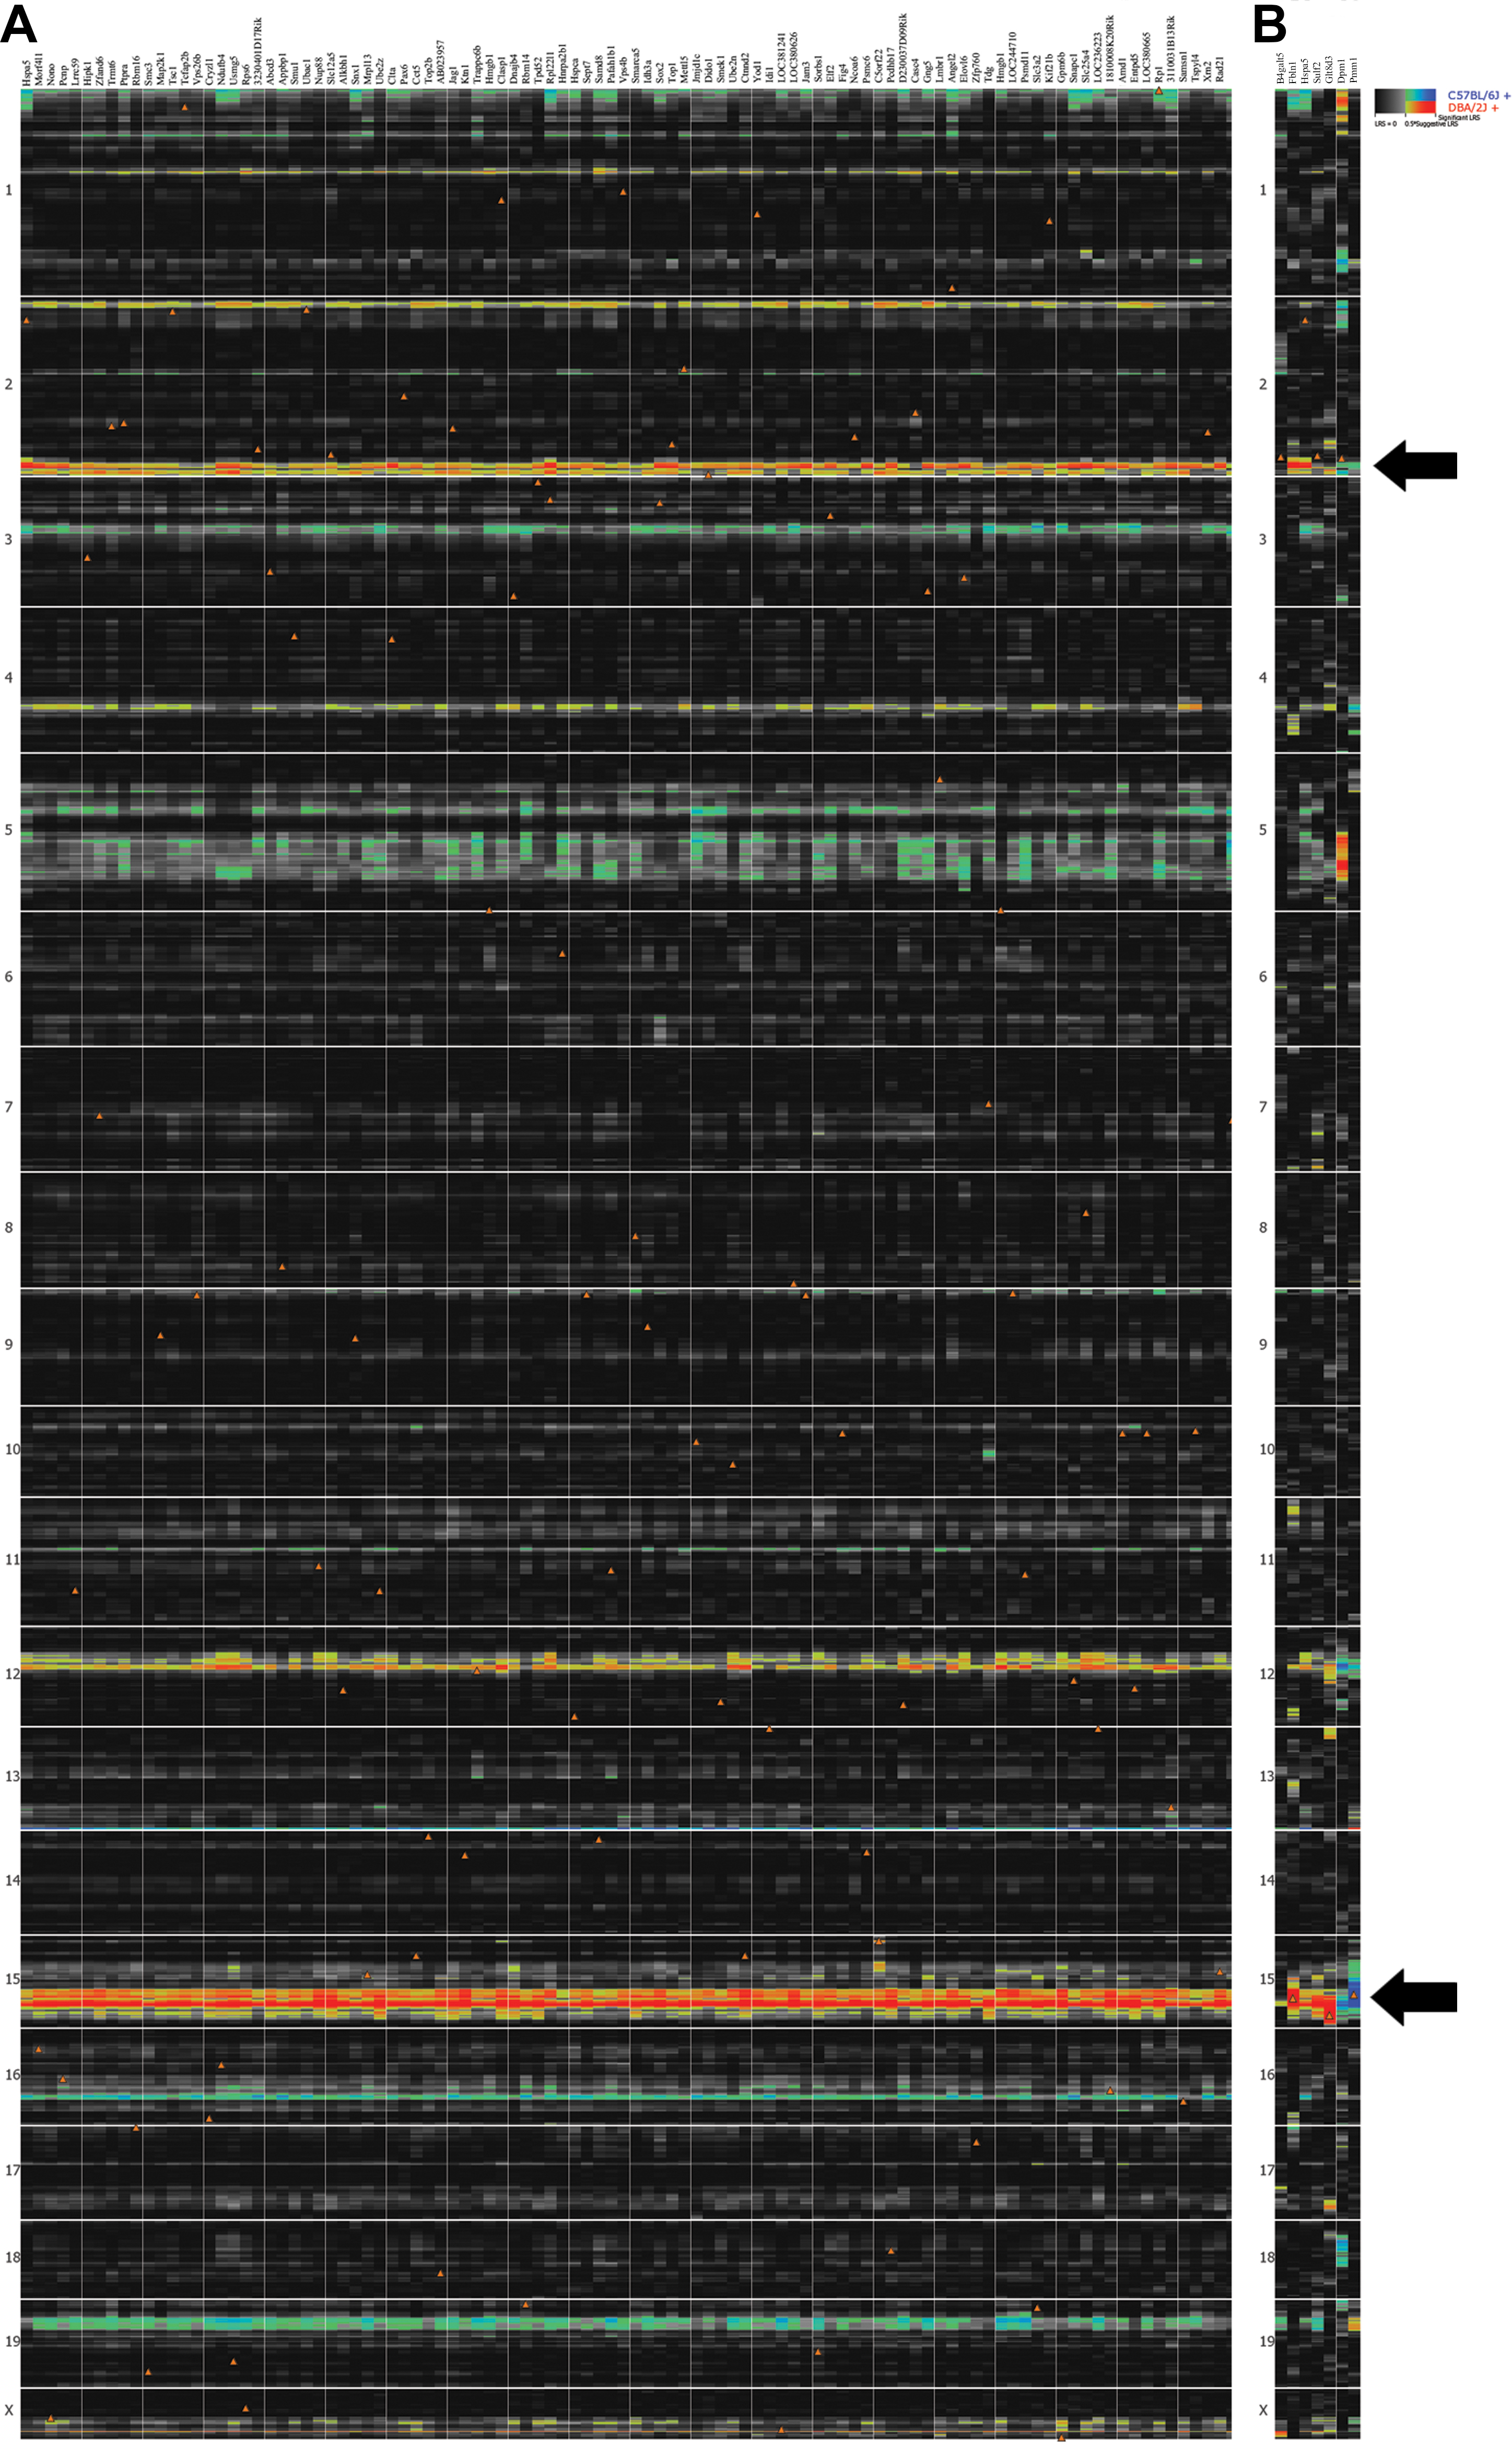
 Figure 4 of
Chintalapudi, Mol Vis 2016; 22:1318-1331.
Figure 4 of
Chintalapudi, Mol Vis 2016; 22:1318-1331.