Figure 3. Expression levels of Hspa5 across the BXD strains and simple interval mapping. A: Rank-ordered mean Hspa5 levels across the BXD recombinant inbred family ranges from 6.9±0.2 in BXD80 to 8.4±0.3 in BXD102. The values denote the
normalized relative expression levels on a log2 scale (mean±SEM). B: The QTL simple interval map of genomic regions that modulate Hspa5 expression in the retinas of BXD mice. A significant trans-eQTL for Hspa5 is present on Chr 2 and a second trans-eQTL is present on Chr 15 (circles). The blue tracings indicate the LRS scores across the genome. The x-axis represents the LRS scores across the genome. The horizontal lines represent the transcript-specific significance thresholds
for significant (LRS = 17.21) and suggestive (LRS = 10.48) LRS levels indicated by red and gray horizontal lines, respectively.
The filled triangle on Chr 2 indicates the location of Hspa5 in the genome.
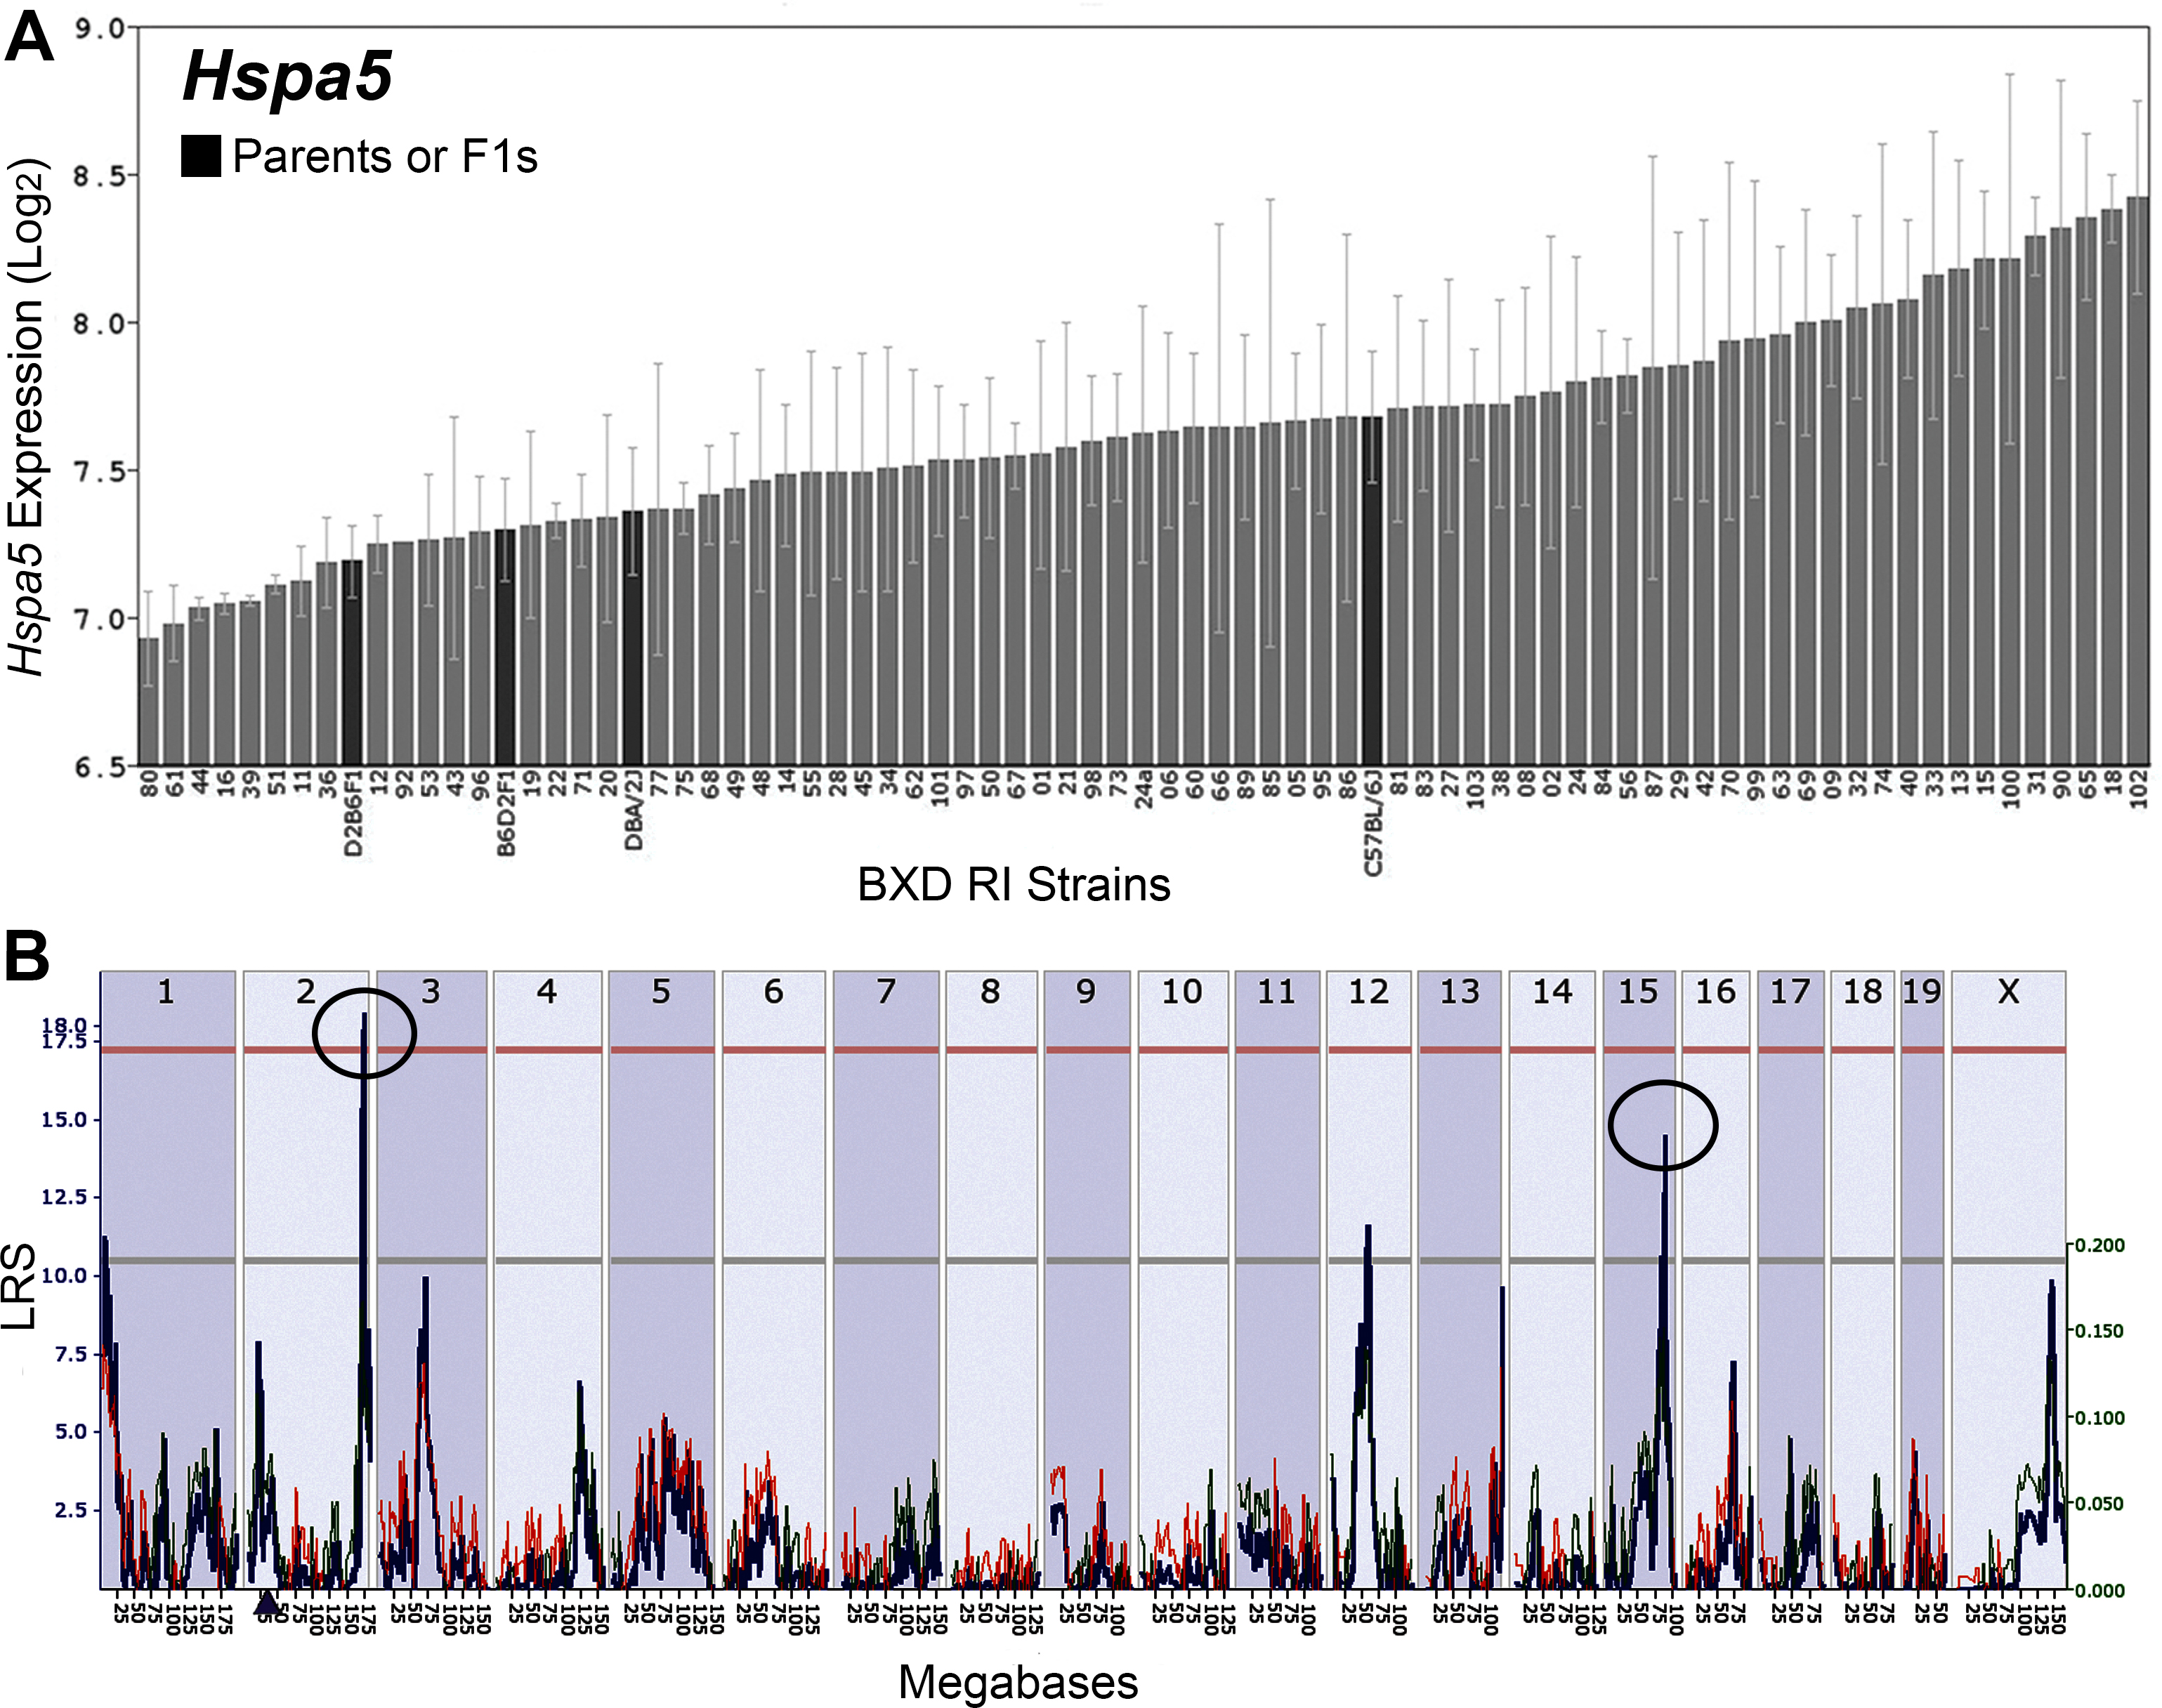
 Figure 3 of
Chintalapudi, Mol Vis 2016; 22:1318-1331.
Figure 3 of
Chintalapudi, Mol Vis 2016; 22:1318-1331.