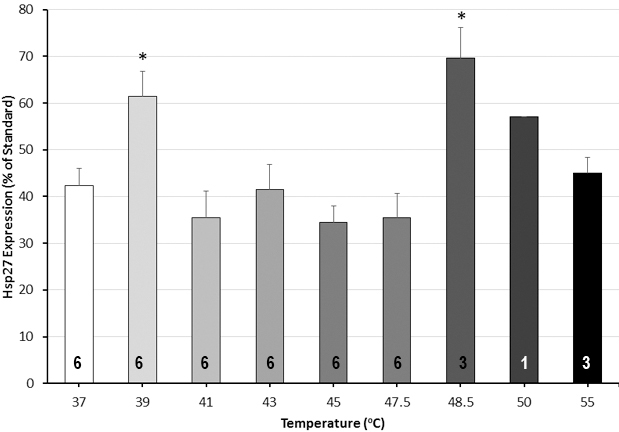
Figure 5. Content of Hsp27 in the lens 24 h after 1 h of heat shock at various temperatures. All values are expressed as mean ± standard
error of the mean (SEM; n = 4–6 per temperature as indicated on the histogram). * represents p<0.05 versus 37 °C.
 Figure 5 of
Dzialoszynski, Mol Vis 2016; 22:1309-1317.
Figure 5 of
Dzialoszynski, Mol Vis 2016; 22:1309-1317.