Figure 3. Segmental linear analysis to analyze normalized clarity (the image contrast ratio) versus temperature revealed that clarity
slowly declined as the incubation temperature increased until a breakpoint at about 47.5 °C whereupon there was a sudden loss
of clarity (n = 6 at all temperatures with the exception of n = 3 and n = 4 at 47.5 °C and 48 °C, respectively). All data
are expressed as mean ± standard error of the mean (SEM).
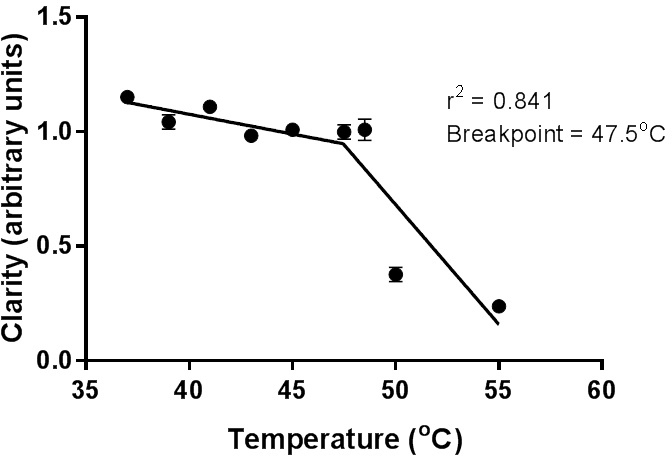
 Figure 3 of
Dzialoszynski, Mol Vis 2016; 22:1309-1317.
Figure 3 of
Dzialoszynski, Mol Vis 2016; 22:1309-1317.