Figure 1. Typical photographs of lenses in culture dishes showing graph paper with a 1 mm grid behind lens and culture dish. A, C: The control and post heat-shock lenses, respectively. B, D: The images show how clarity was determined. The average gray value, divided by the number of pixels of the grid within the
total area of the lens, was divided by the average of the same measure of two to three adjacent areas (the same diameter)
outside the lens. Note the loss of clarity of the grid lines beneath the heat-treated lenses (B and D).
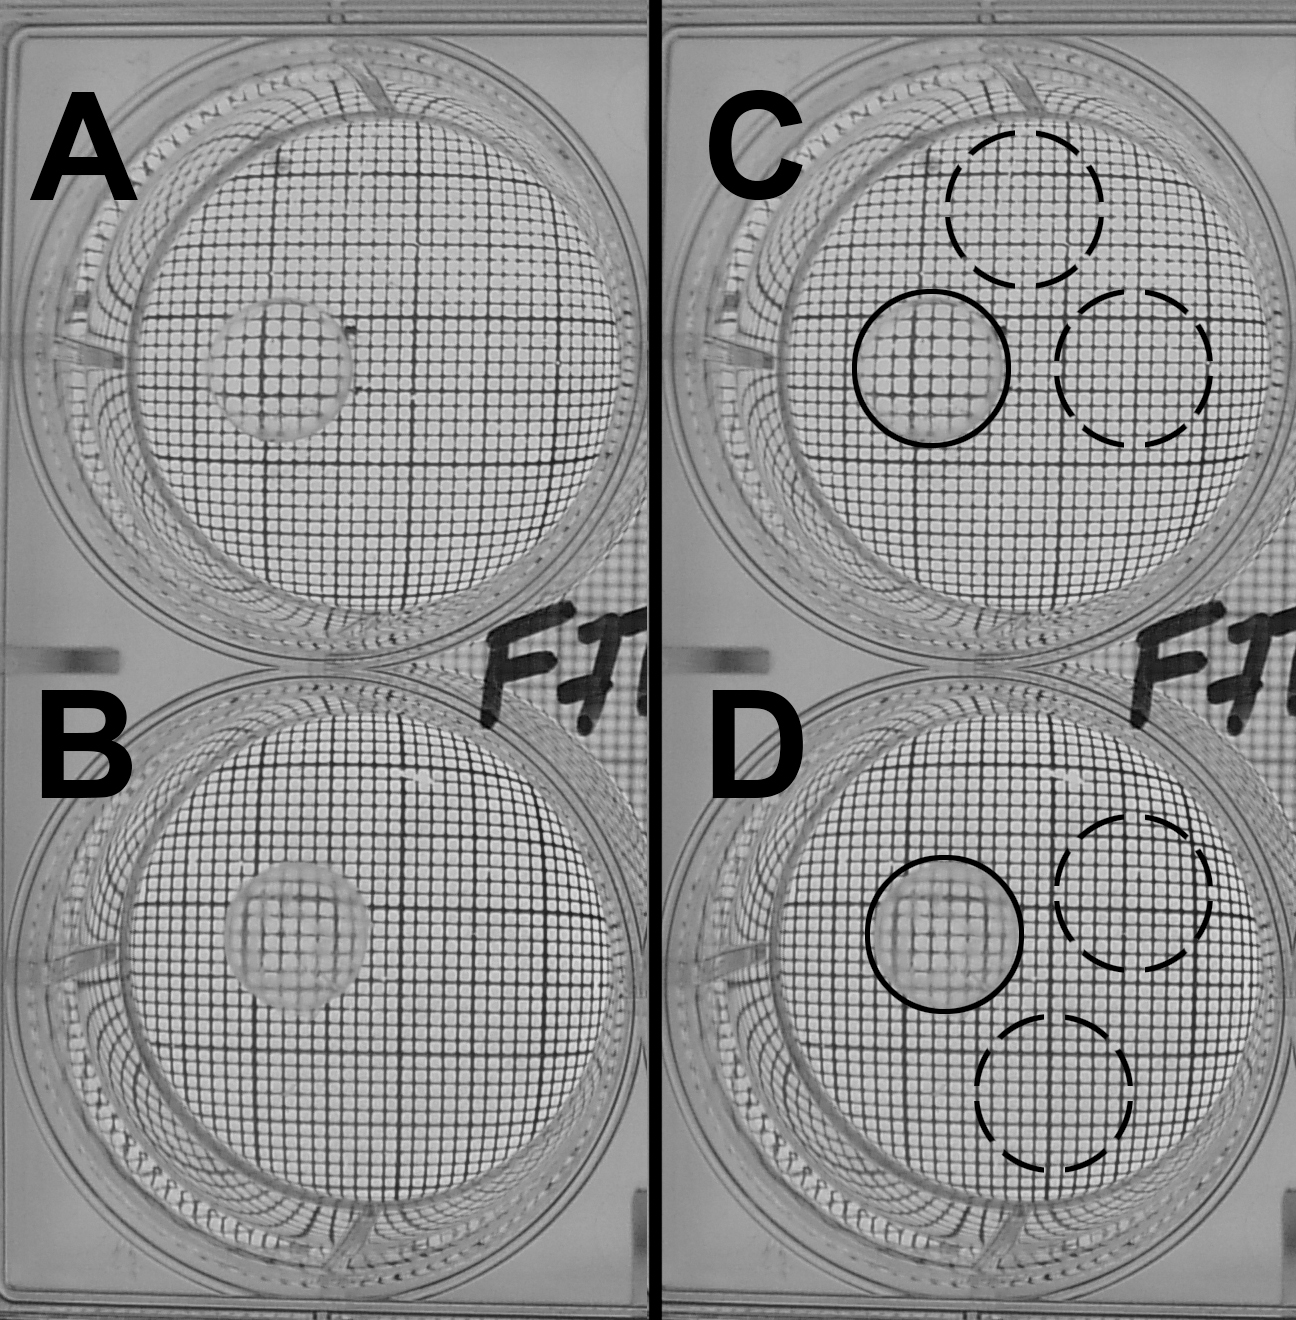
 Figure 1 of
Dzialoszynski, Mol Vis 2016; 22:1309-1317.
Figure 1 of
Dzialoszynski, Mol Vis 2016; 22:1309-1317.