Figure 2. Apparent solubility of compstatin peptides. A: The difference in concentration, calculated – observed (measured), in mM, plotted against the expected concentration (in
mg/ml). The actual observables are plotted, the expected concentration (in mg/ml) of the dilution series on the horizontal
axis, and the observed (in mM, measured using tryptophan absorbance) minus the calculated (in mM, from the mg/ml expected
concentration values) on the vertical axis. Peptide 2 is the most soluble, as the concentration difference is close to zero
and remains nearly constant in the dilution series. B: Correlation of the observed concentration with the calculated concentration, with the concentrations presented in mM. Peptide
2 is the most soluble, as indicated by the high correlation between the observed and calculated concentrations (slope of 0.92).
Each data point represents the mean measured concentration and the corresponding expected concentration with a linear regression
fit to the data. A straight line of slope 1 passing through the origin is inserted to indicate the closeness of the data to
perfect correlation.
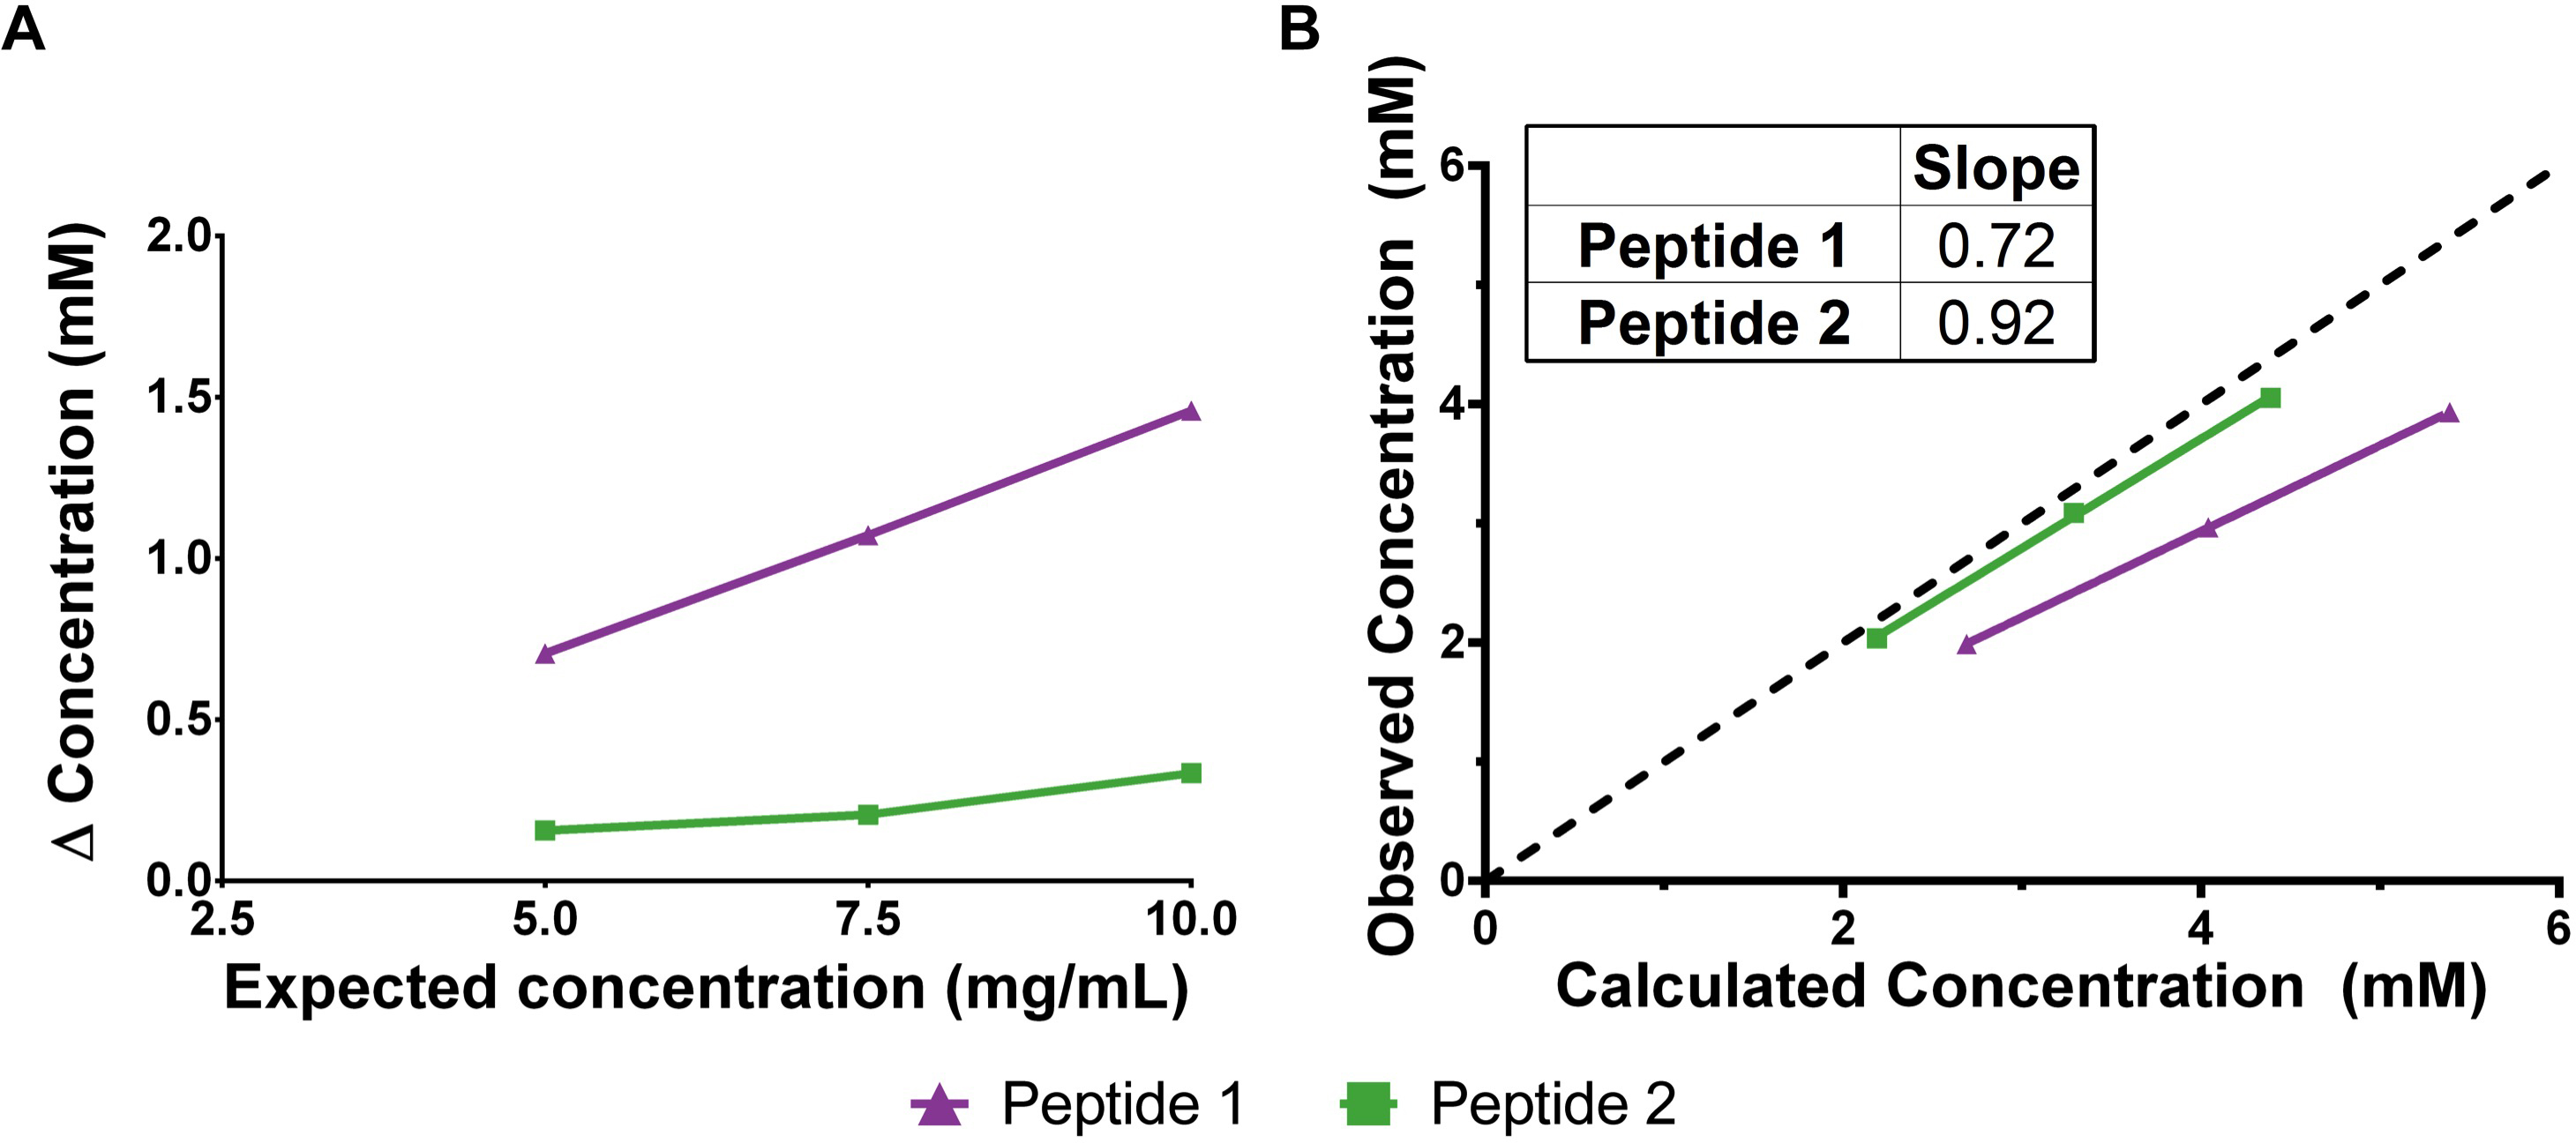
 Figure 2 of
Mohan, Mol Vis 2016; 22:1280-1290.
Figure 2 of
Mohan, Mol Vis 2016; 22:1280-1290.