Figure 1. Concentration-dependent inhibition curves of compstatin peptides in four replicate hemolytic assay experiments. The plotted
data represent the mean percent inhibition ± standard error of the mean (SEM). The dashed line intersects each inhibition
curve at the IC50. Peptide 1 is the parent peptide (positive control), and Peptide 2 is the PEGylated form of the parent peptide.
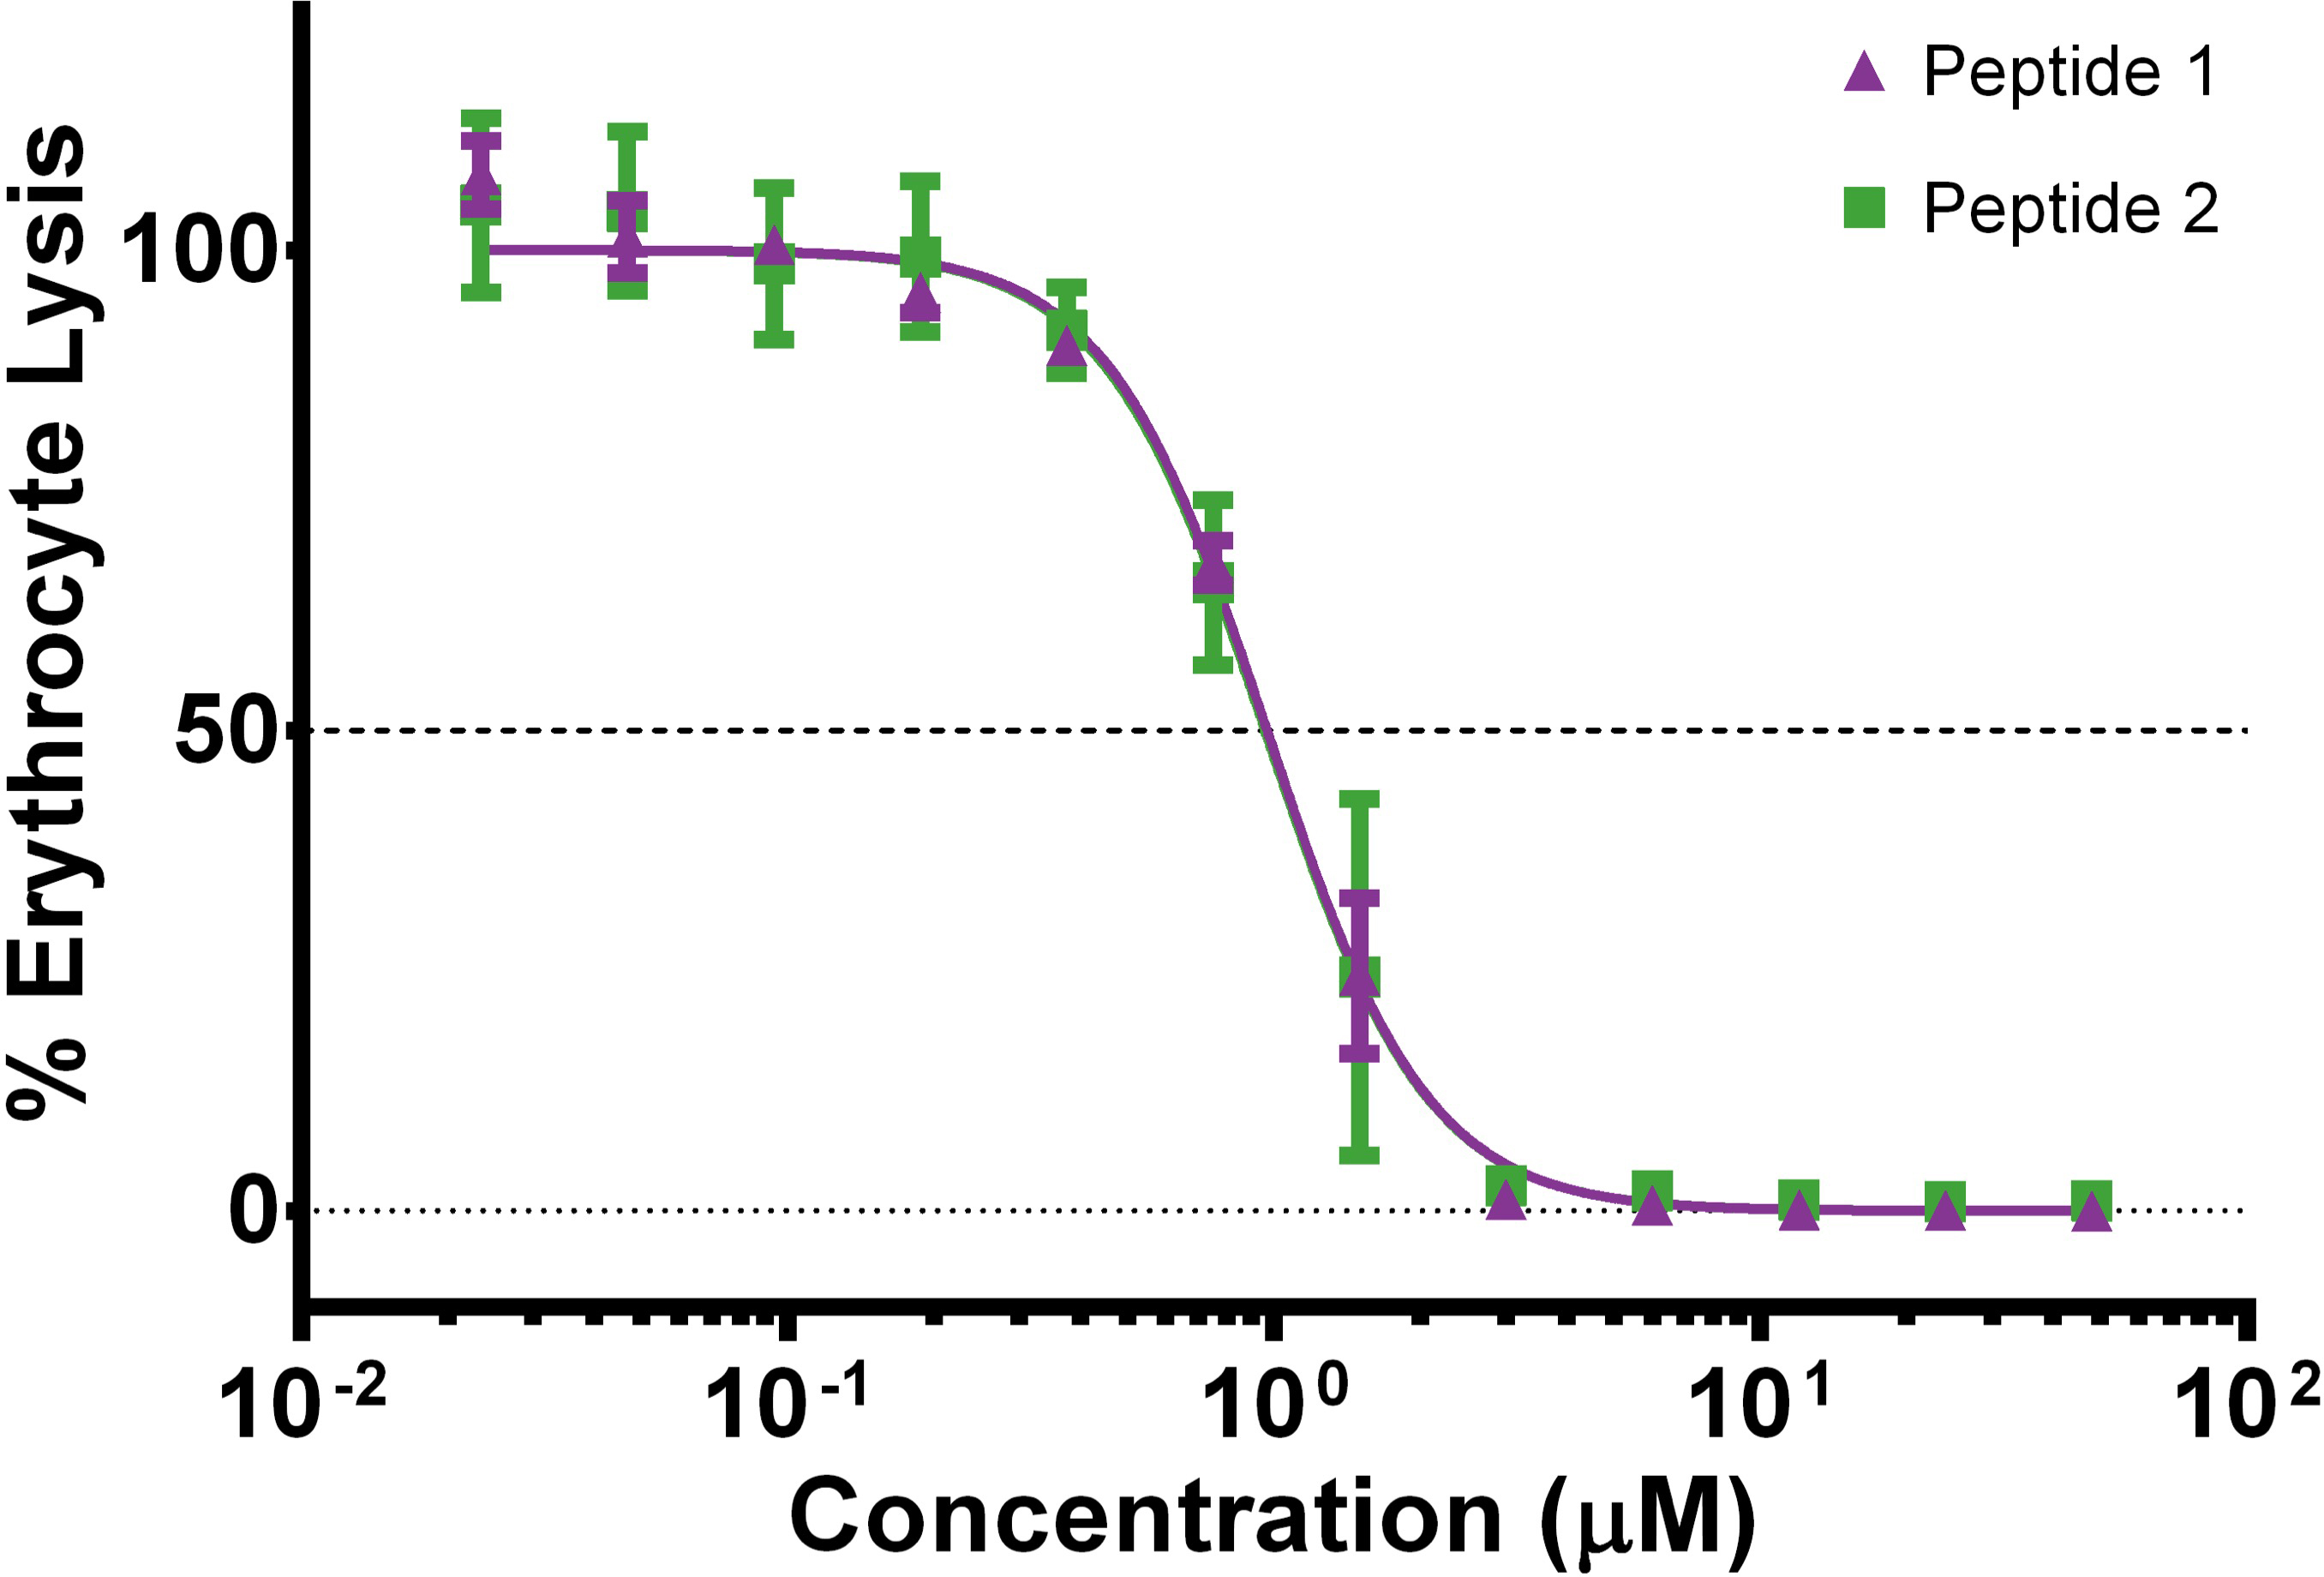
 Figure 1 of
Mohan, Mol Vis 2016; 22:1280-1290.
Figure 1 of
Mohan, Mol Vis 2016; 22:1280-1290.