Figure 2. ASOCT. A: The upper left panel shows an example of an untreated cornea before transplantation. C: The upper right panel shows an anterior segment spectral domain optic coherence tomography (ASOCT) image of a transplanted
cornea at day 15 after transplantation; the yellow line indicates the caliper for the graft thickness assessment. The black
bars (B and D) indicate the location of the ASOCT section. Examples of syngeneic (E and F) and allogeneic grafts at day 6 (G and I) and day 15 after keratoplasty (H and J). Each panel shows photographs of the cornea (E–J). The black bar indicates the location of the tomographic section. The photographs depict a clear corneal transplant at day
6 for all animals (E, G, and I). After syngeneic transplantation, the cornea remains transparent until day 15. Afterward, the allogeneic transplants show
signs of rejection, that is, an increase in opacity and corneal edema (H and J). ASOCT shows no differences between the syngeneic and allogeneic transplants at day 6 (E, G, and I). However, there is an increase in edema at day 15 in the allogeneic keratoplasties (H and J). The syngeneic transplants showed a decrease in edema at day 15 (F).
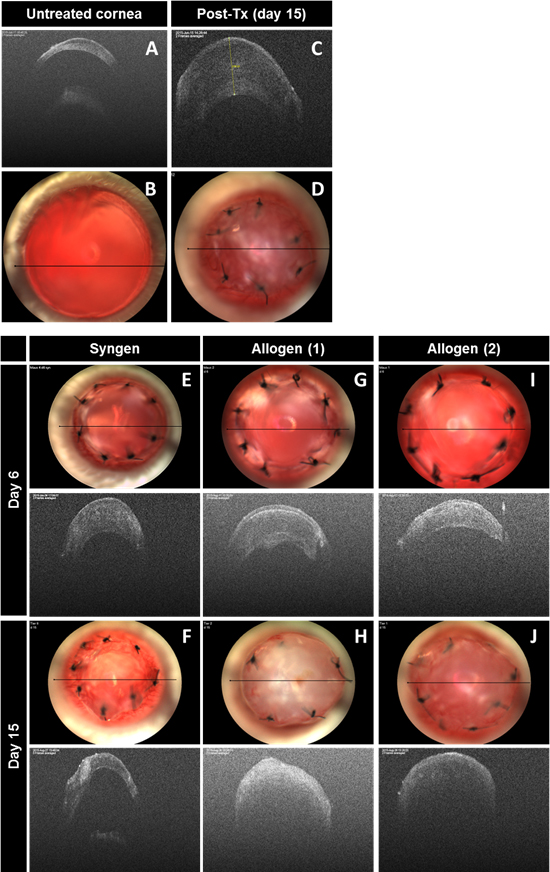
 Figure 2 of
Lapp, Mol Vis 2016; 22:1248-1255.
Figure 2 of
Lapp, Mol Vis 2016; 22:1248-1255.